Table of Contents
While WordPress is great software because of its ease of use, it does have a history of using excessive server resources (such as memory and/or cpu time) at times. This is not always the fault of WordPress directly, but instead it could be the result of either:
- a “bad” plugin
- a custom theme
With so many lines of code in WordPress and custom user code written in plugins and custom themes, pinpointing directly where the excessive server resource usage is occurring is a difficult task.
InMotion Hosting has developed a WordPress plugin that can help identify where in your WordPress installation there is a problem. This plugin is called Memory Viewer.
How Does the Memory Viewer Plugin Work?
WordPress is built up of many different functions that perform specific tasks. These functions run at very specific times during WordPress’ execution. For example, there are functions that run when WordPress begins to load your theme, and there are specific functions that run when WordPress is creating your site’s footer. For plugin and theme developers, WordPress has created several different “hooks” in which you can run your custom code.
What the InMotion Hosting Memory Viewer Plugin does is jump in at certain hooks and logs specific data, including:
- The current memory used by WordPress at that time
- The maximum amount of memory used by PHP at that time
- The number of MySQL queries that have run at that point
- The amount of time MySQL has used up to that point
So in summary, the Memory Viewer Plugin takes snapshots of WordPress’ activity at certain points in WordPress’ execution.
How do I use the Memory Viewer Plugin?
- Download and install the pluginThe first thing you’ll want to do is download and install the WordPress Memory Viewer Plugin:
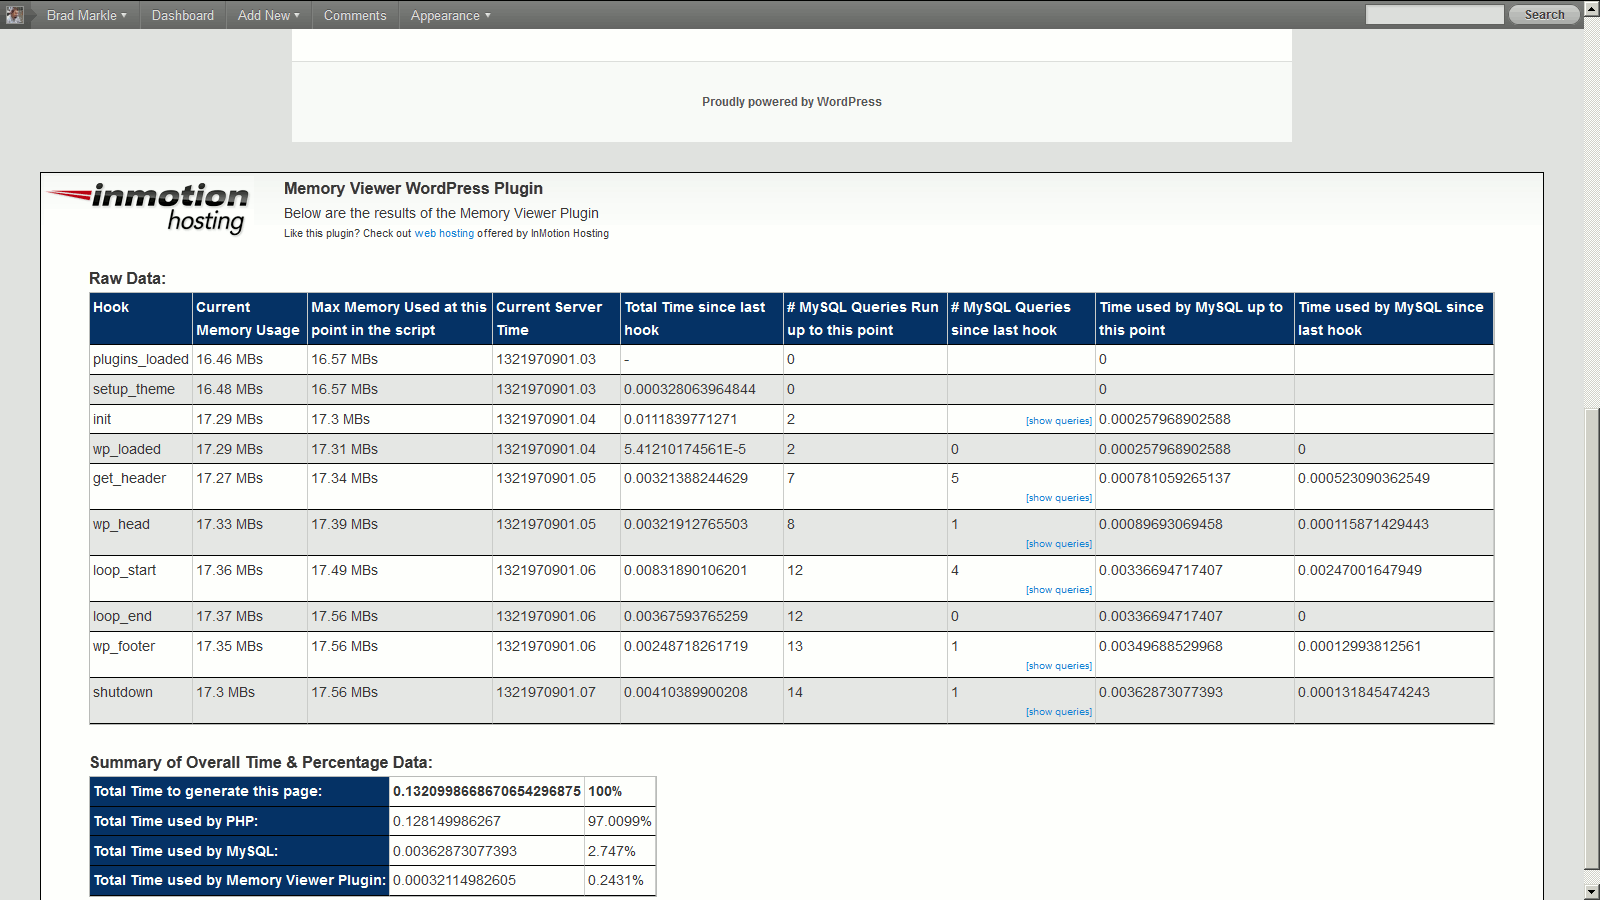
WordPress Memory Viewer 1.5 - Install and activate the pluginAfter installing and activating the plugin, visit one of your WordPress pages. At the bottom of the page, you’ll see a table of data, similar to the screenshot below:

Please note that this data will only show when you are logged in as an administrator.
- Scan the data for any abnormalitiesAt this point you can scan the data for any abnormalities. For example, if at one hook you’re using 15MB of memory and then at the next you’re using 50MB, you can get a good idea of where in WordPress’ execution the big jump in memory took place. You can also click the “show queries” link to view the exact queries that were ran between the two hooks. More importantly, you can see how much time it took for each query to run.
While the plugin is named “Memory Viewer”, it also tracks cpu time, which may be the culprit (and not memory usage). You can review the time between each of the hooks to help determine if there is a problem somewhere. For example, if the average time between hooks is about .005 seconds and you notice an abnormal time of .9 seconds as one of the entries, this can help pinpoint where in the script it is taking long to execute.
How much Memory and CPU time should WordPress be Using?
The numbers we mentioned above were just examples that we came up with. Due to variations in server setups and how different hosting companies track server resource usage, we unfortunately cannot answer specifically the question of how much memory and CPU time your WordPress installation should be using.
What we can do however is show you average data for a bare bones WordPress installation with only the Memory Viewer Plugin enabled. You can then compare your data against ours to determine how heavy your script is running.
| Average Total Time to generate the entire page | 0.1254 seconds |
|---|---|
| Average Total Time used by MySQL | 0.0017 seconds ( 1.35% of total time) |
| Average Maximum amount of memory used at any point | 17.56MB |
| Total number of MySQL Queries Ran: | 14 |
Can I log data at other times in WordPress’ Execution?
Yes! You can place the following code in your PHP code to take a snapshot of server usage at that time.
mvimh_log_data_at_hook(“identifier”);
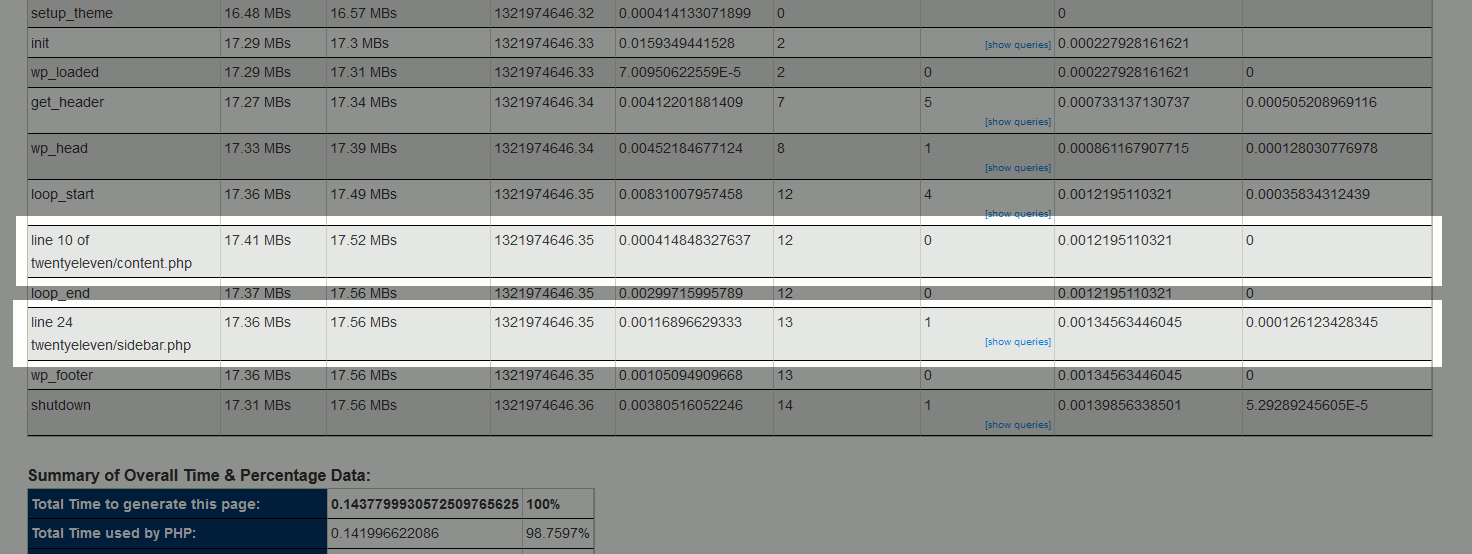
The “identifier” is just any text to help you identify the data in the table. For example, in the screenshot below, we used the following functions:
mvimh_log_data_at_hook(“line 10 of twentyeleven/content.php”);
mvimh_log_data_at_hook(“line 24 twentyeleven/sidebar.php”);
Please be aware however that you cannot run these functions at any time you wish. They will only run after the Memory Viewer plugin as been initially loaded by WordPress.
How can I receive additional support / report bugs / suggest features?
If you have any questions about using the WordPress Memory Viewer plugin, feel free to ask a question or post a comment (on the bottom of this page), and we’ll be more than happy to help!


