Table of Contents
The ab command also known as ApacheBench is a command line benchmarking tool for testing the amount of time it takes your server to respond to HTTP requests. You can use this information to determine the estimated number of simultaneous requests your Apache HTTP server can handle before it begins to degrade the overall performance.
In this guide, we’ll explain what ab is and how to use it, then perform a case study to show you how to stress test your website with ab.
- What is ab (AbacheBench)?
- How Do I Use ab?
- Running Your First Benchmark Test
- Reviewing the Test Results
- What Effect Does ab Have on my Server?
- Stress Testing Sites – Case Study
- Troubleshooting
- Beware – Only Test Sites That You Own
What is ab (ApacheBench)?
ApacheBench is used by website managers and system administrators to pressure test sites/servers and identify the limits of the environment. It is run by using the ab command and it is used to test the ability of a web server to handle a large number of HTTP requests at the same time.
Requests can be sent “concurrently” meaning they run at the same time. You can also set the requests to stay open (HTTP KeepAlive) which puts an increasingly larger amount of stress on your environment. This simulates a heavy load of traffic to your server by slamming it with simultaneous requests.
This will then provide an output that lists how long in milliseconds it takes the server to respond to the requests while under an increasing amount of usage. You can then use this data to determine if your site/web application is capable of managing the predicted load. If it is not able to continue responding within a reasonable amount of time it indicates that you may need to upgrade your Apache HTTP server.
How Do I Use ab?
You can run ab directly from a server or even your local computer. We recommend using a separate server from the one you are testing so it does not interfere with the testing process.
To view the basic usage and options for the ab command by running the help command.
This will provide the following information:
For more detailed information you can view the command manual.
Install ab on Windows 10
- Go to apachelounge.com, download and extract the latest version of Apache, then extract it.
- Search in your taskbar for Control Panel then click it.
- Click System and Security then System.
- On the right click Advanced System Settings then click the Advanced tab (if you are not already there).
- Click the Environmental Variables… button.
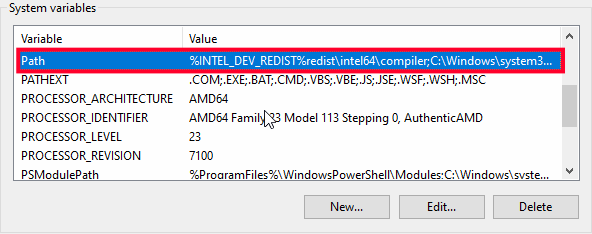
- Under System Variables double click the Path variable.

- Click the New button then Browse.
- Navigate to the /Apache24/bin folder that you downloaded and extracted then click OK, OK, and OK to close the windows and save the new system variable.

- Open a new command prompt (windows key->cmd) then you can use the ab command.
Install ab Linux
- With Ubuntu and or Mint you can install ab with the following command:
- Type your password then click the Enter key.
- Click the y then Enter key to continue. The ab tool will then be installed.
Install ab on Mac
ApacheBench is installed on Mac computers by default and should not require any additional installation before it can be used.
Running Your First Benchmark Tests
To begin, connect to your server via SSH and run one of the following commands.
Basic ab Test
First, we will run a basic test with the -n option, which will allow you to choose how many requests you want to send. Without adding this option it will only send one single request. Run the following command to send 10 individual requests, which should not be difficult for your server to handle. But this can be a good starting point for comparing later results.
Increase the Number of Requests Sent
Now that you know how to run a basic test, you can increase the number of requests that are sent. In this example, we will send 500 requests but you can increase the number as needed to compare results.
Increase the Number of Concurrent Requests
Next, we will add the -c option to make the requests concurrent, which means they will run at the same time. In this example, we will send 500 requests with 50 being sent simultaneously at a time.
Performing a Persistent ab Test (KeepAlive)
The -k option adds a KeepAlive header allowing the server to keep the connection open so it can be used again.
Output ab Test to a File
Use the -g option if you want to save the test results to review later or prefer to read them in a text file. In this example, I’m going to save them to a file called test.txt.
You can then review the file using an editor such as nano or vi by running one of the following commands.
View the ab Test Results File With nano
Exit nano by clicking Ctrl+X
View the ab Test Results File With vi
Exit vi by typing :q! then clicking Enter.
Reviewing the Test Results
While running these tests, ab will list how many requests are completed then how many finished. It will then provide a summary that looks like this.
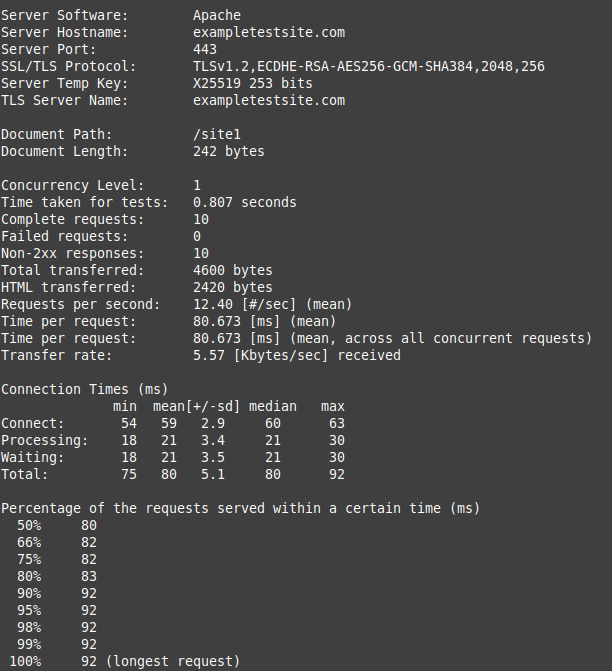
You can review the results and determine how your server performed. We will now go over some of the data that the ab test will provide.
Time taken for tests/Complete requests/Failed requests

Requests per second/Time per request/Transfer rate
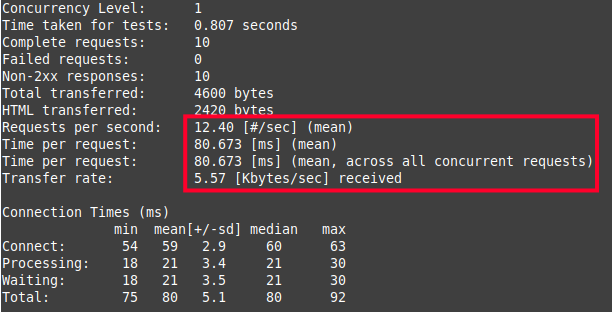
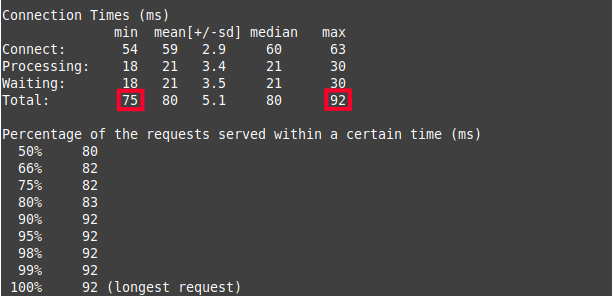
Connection Times
For this section, I will typically look at the Total minimum (fastest response) and the Total max (longest response).
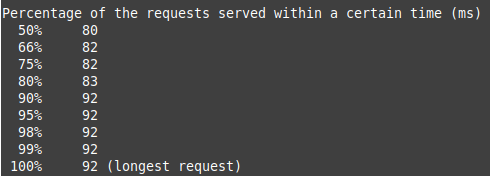
Percentage of the requests server within a certain time (ms)
This data can help you determine the number of requests your server can respond to before the performance begins to degrade. For example, if you perform a test and notice a spike in time at 90% of your total requests, this indicates that may be near the limit of what it can handle.
What Effect Does ab Have on my Server?
If you want to monitor the amount of stress these ab tests are putting on your server, you can run a command such as top or htop to monitor your server’s performance and see how much of your resources are being utilized by the process.
Monitor CPU Usage
We will now show you how to monitor your server usage with the top and htop commands.
Monitor With top
- Login to your server via SSH.
- Run the following command
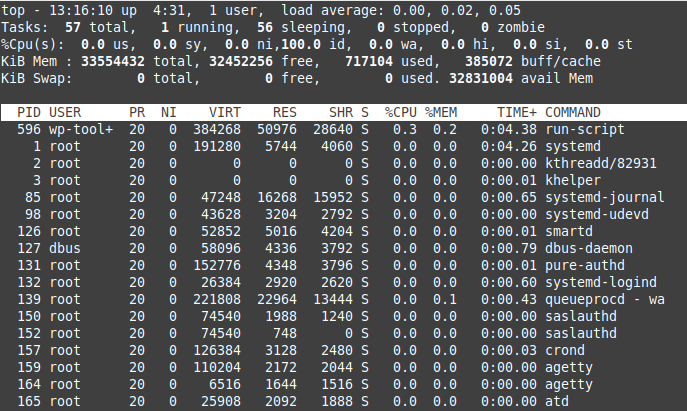
You should then see realtime results similar to this.
Monitor With htop
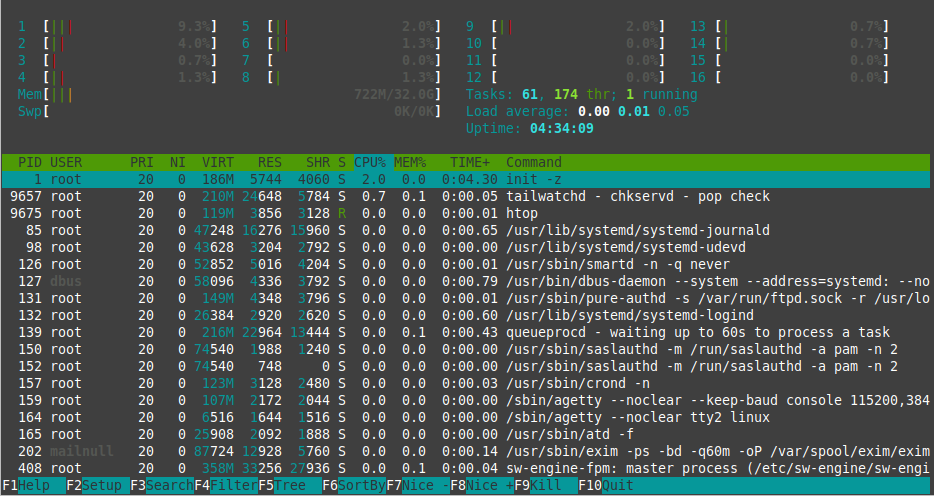
Some may prefer to use the htop command since it provides a more robust visual breakdown of the computer’s resource usage.
- You may have to install htop by running the following command, click the y key, then Enter.
- Run the following command.
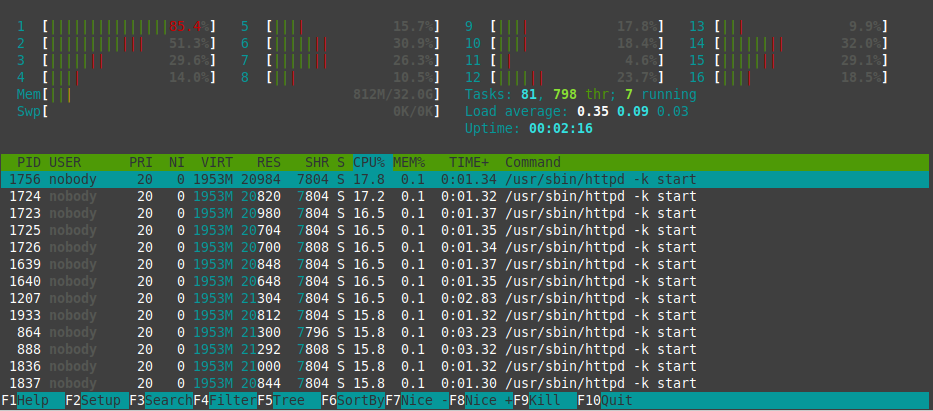
You will then be able to monitor your server’s resource usage in realtime and it will look similar to this.
Stress Testing Sites – Case study
For this case study, I will be creating three different websites and then performing the same ab test on them so we can compare results. These sites are all hosted on a VPS Hosting plan from InMotion. The first site will be a blank WordPress site, the second site will be WordPress with a BoldGrid Inspiration installed, and the final site will be the same Boldgrid Inspiration site with W3 Total Cache Installed.
The following is the ab command we’ll use on all three sites.
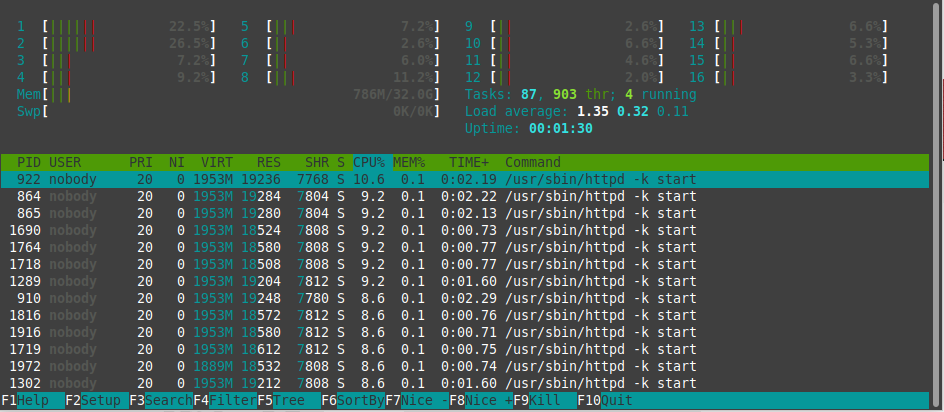
Before we get started I’m going to run the htop command so we can see how the server is performing before we begin testing. There’s not a lot of CPU or memory being utilized on this server.
Blank WordPress Site
This first test is on a clean WordPress installation with no caching setup.
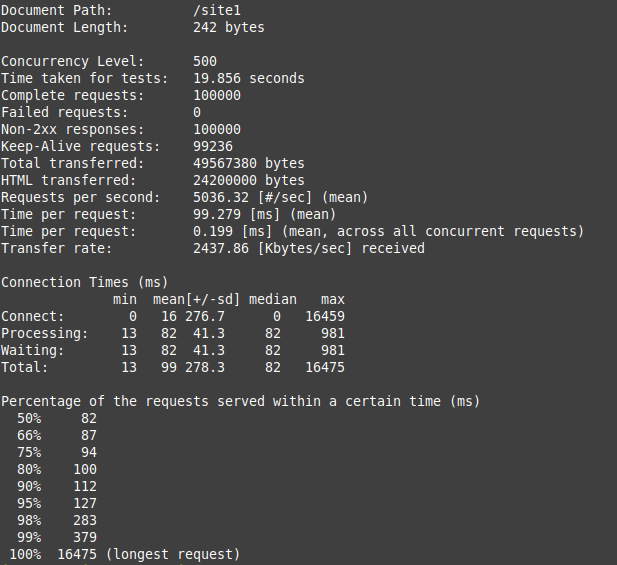
Test #1 Results
Here are the results of running htop during the test. Notice how the CPU, memory, and Load average increase from the initial test we shared earlier.
WordPress Site With BoldGrid Inspirations Installed
The second site we are testing is a new site with only a BoldGrid Inspiration installed.
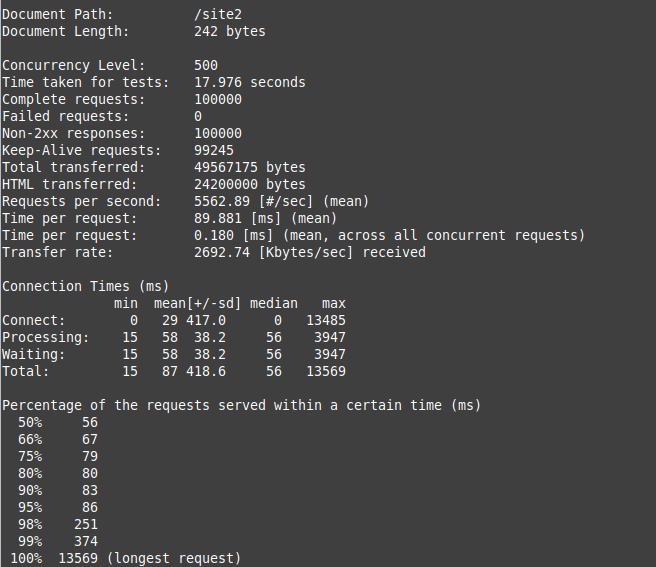
Test #2 Results
With the second site, the test was completed a second faster. Also notice that it completed 526.57 more requests per second on average. Also the longest request took 13 seconds as opposed to 16 with the first test.
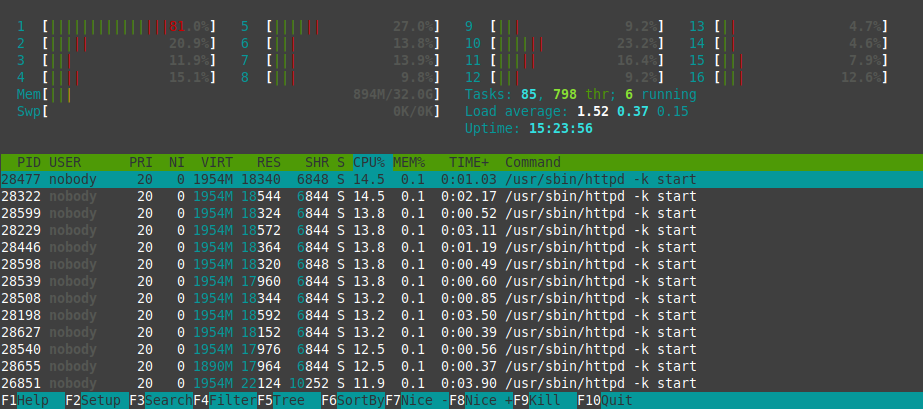
Here are the results of running htop during the second test. Here we see that the CPU and load average have spiked considerably but it was still able to complete the test without any failures.
WordPress Site With BoldGrid Inspirations & W3 Total Cache Installed
Finally, we’ll test the same site from Test #2, but with W3 Total Cache Installed.
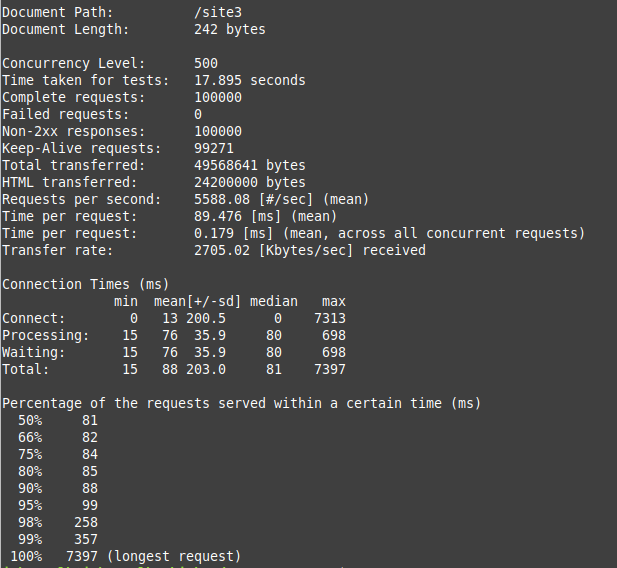
Test #3 Results
With the final test W3 total cache seems to help serve the requests faster, resulting in 25 more average requests per second and also no failed requests. What really stands out is that the longest request only took 7 seconds as opposed to 16 (Test #1) and 13 (Test #2).
You can also see this lighter load average reflected when we run htop, even though the CPU usage spiked.
Comparing the Results
Here is a graph of the test results comparing the blank site, Inspiration Site, and Inspiration Site with W3 Total Cache installed.
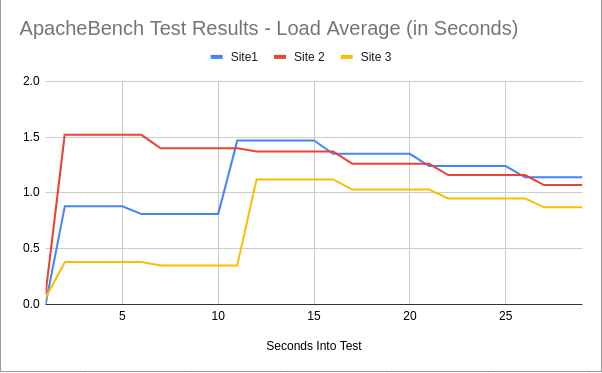
Notice how the load on the site using W3 Total Cache does not spike as high overall, while the first and second site results are relatively similar. This provides further evidence that caching can help reduce the amount of load on your server. So, even if a strong server can handle a large number of requests, when you use caching it can reduce the level of resources being used.
Troubleshooting
Too many open files (24)
When I increased the concurrency too high, it often results in this error. I then reduced the concurrency level incrementally until the test was able to complete successfully.
SSL handshake failed (5)
This error seemed to occur later in the day when the server was possibly busier and handling other typical tasks. In this case, I reviewed the tasks using htop and was able to determine there was a spam filter and backups running as well causing several of my requests to fail, even though the ab test completed.
Beware – Only Test Sites That You Own
Congratulations, now you know how to stress test your website with ApacheBench (ab)! We also recommend bookmarking our full guide on How to Stress Test Your Website / Top 3 Load Testing Tools.
