The P3 (Plugin Performance Profiler) tool is an easy way to identify troublesome plugins. One of the great features of WordPress is that it’s highly customizable and you can add extra features and functionality through the use of 3rd party WordPress plugins. However not all plugins are created equally, and some plugins can cause much higher levels of resource usage than other ones.
An easy way to optimize your WordPress site is by ensuring your plugins are not using a high amount of resources on your server. In this guide, we will show you how to find intensive plugins with the P3 (Plugin Performance Profiler) tool.
This plugin will break down the usage of each plugin on your site. You can then remove these active plugins to improve your site performance, which can also help your search engine optimization (SEO) efforts.

If you’re having trouble with your WordPress host, then check out InMotion’s WordPress Hosting. We provide secure, optimized servers that are priced to meet your budget needs!
Free Domain
Free SSLs
Unlimited Bandwidth
Identify Intensive Plugins
Follow these steps to find out which of your WordPress plugins is taking the most time to load on your website.
- Install and Activate the P3 (Plugin Performance Profiler).
- Access it by clicking Tools then P3 Plugin Profiler in the WordPress Dashboard menu.
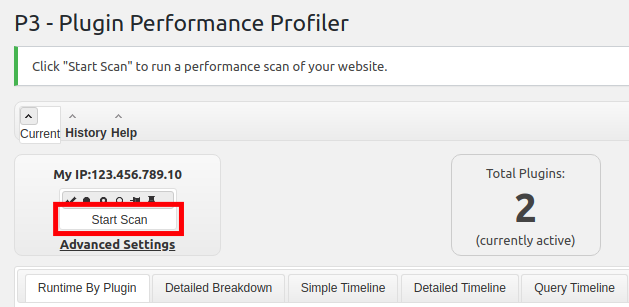
- Click the Start Scan button.

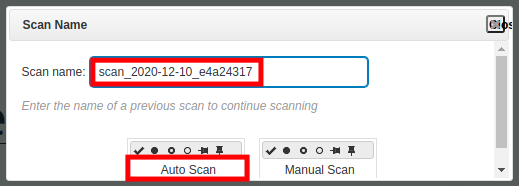
- Give your scan a name then click the Auto Scan button.

- All the installed plugins will then be scanned. Click the View Results button when it completes.

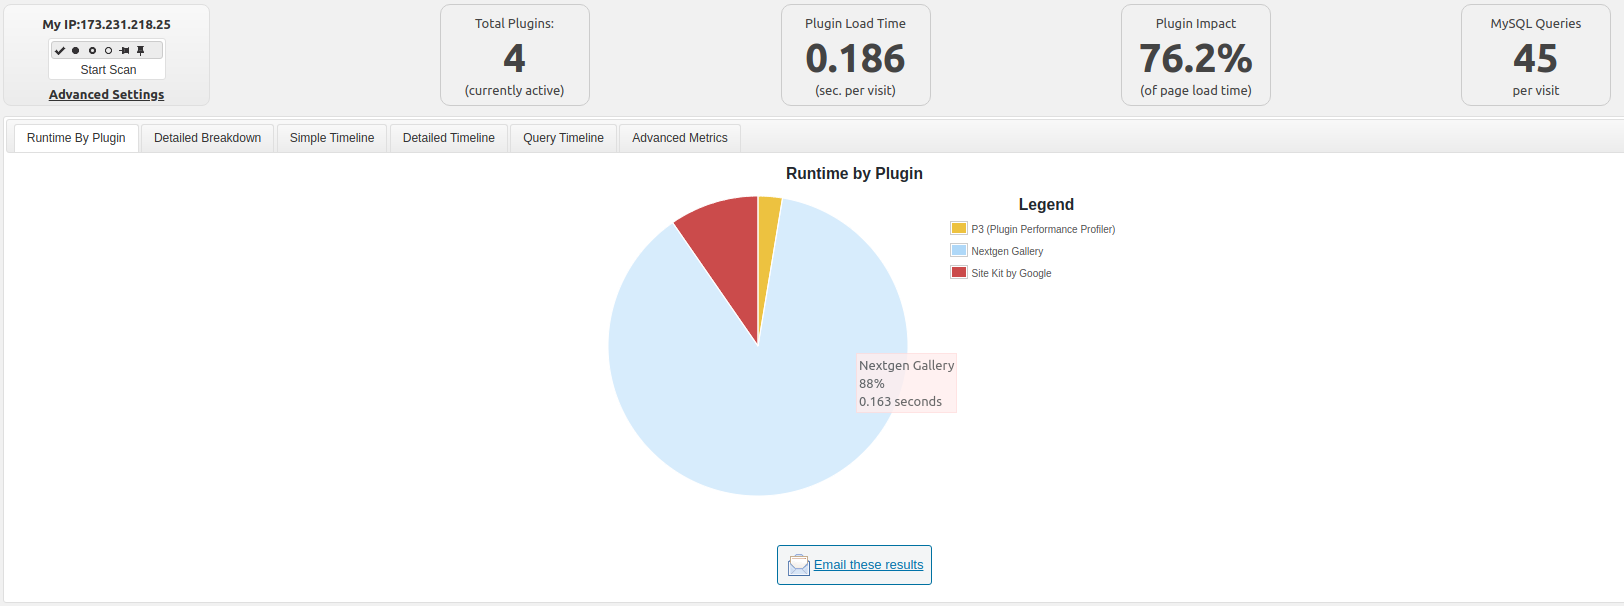
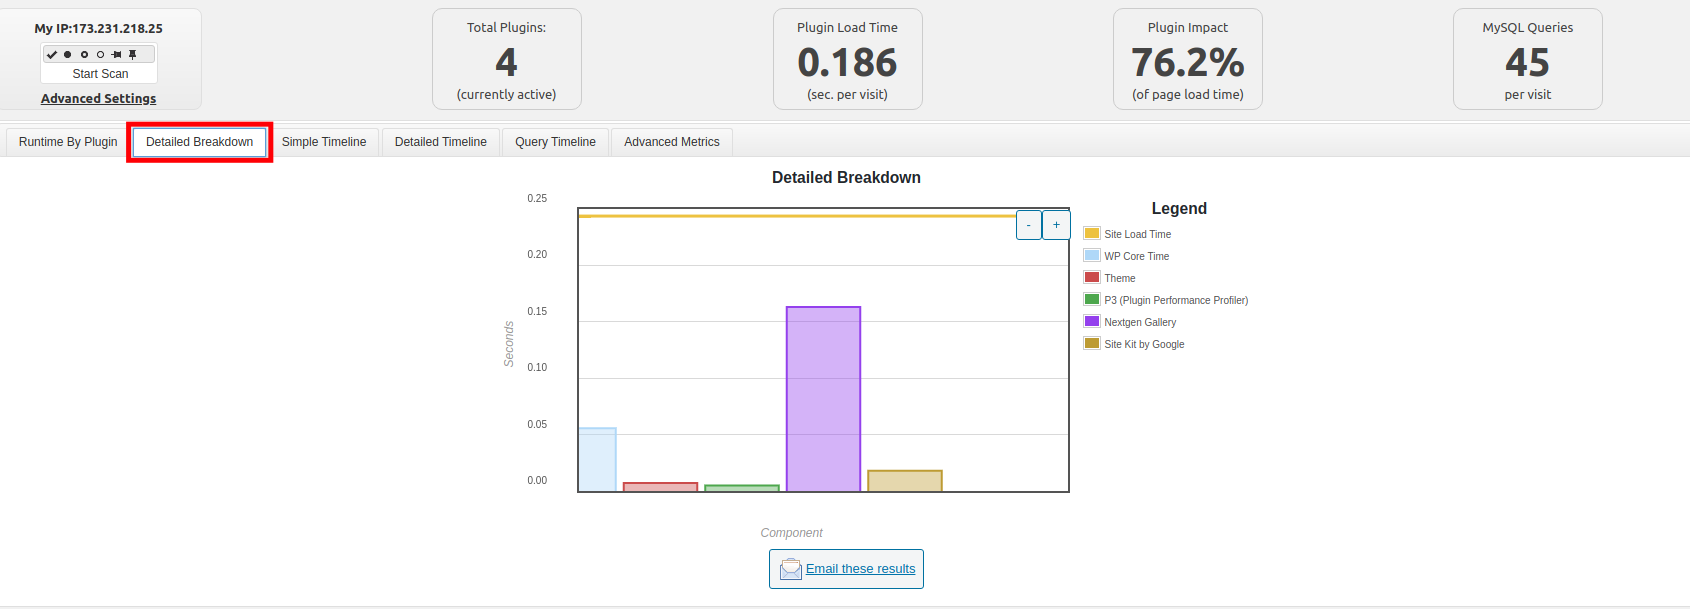
- You will then see a summary that includes: Total Plugins (that are active), Plugin Load Time, Plugin Impact, and MySQL Queries.

A pie chart that breaks down which plugins are utilizing the most runtime. Keep in mind that these results will vary from site to site based on the specific plugins you have installed and how you are using them. Roll your mouse over the section to see some additional details.
- Click the Detailed Breakdown tab to see even more specific information about the plugins that are taking a majority of the load time.

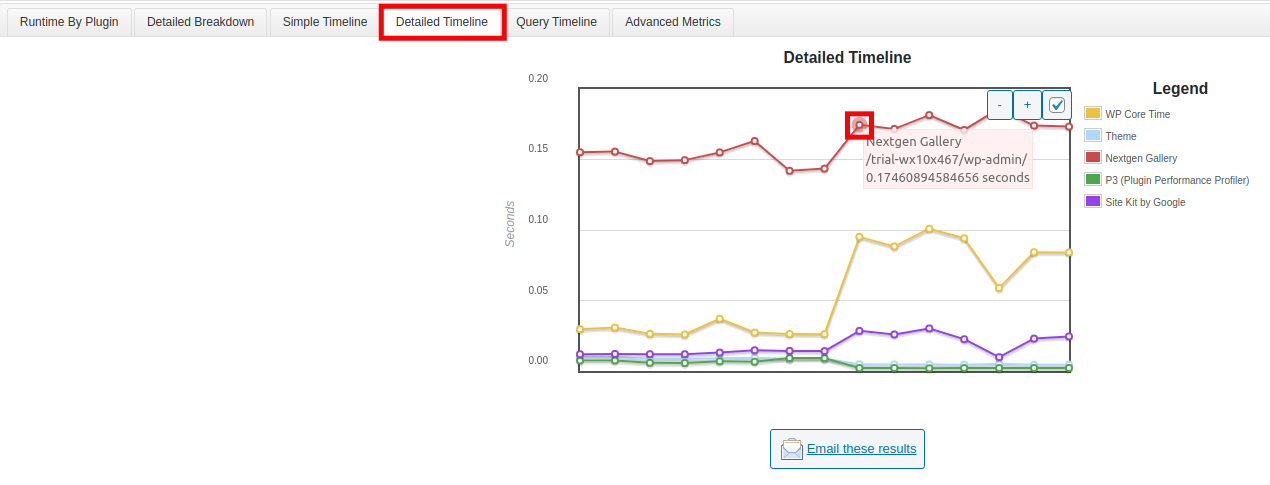
- Open the Detailed Timeline to see a line chart of this data. You can roll your mouse over the plotted points to see how many seconds it was taking at a specific moment.

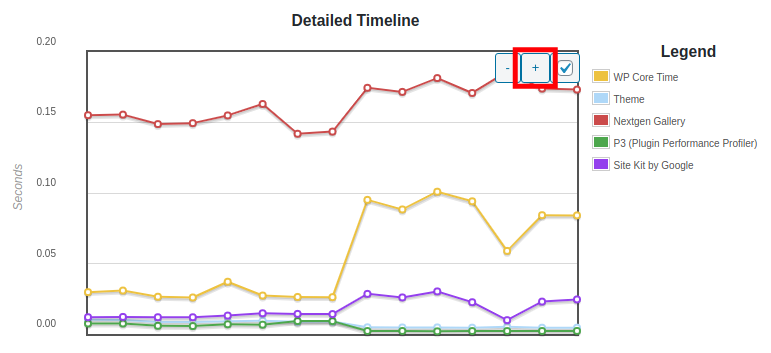
You also have the ability to zoom in for a better view of the information.
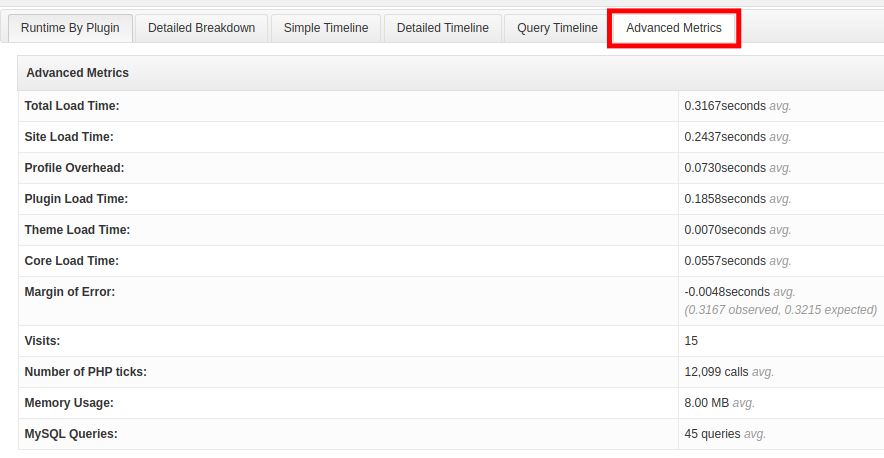
- Click the Advanced Metrics tab to see all the average load times for the different aspects of the site.

- Click the Email these results link to send this scan data to someone. For example, you could send this to your developer and they can help you review it.
Now hopefully you understand how to track down any WordPress plugins that might be causing your site to run slow. Deactivating unnecessary plugins can help you test if they are using up excessive resources on the server.
If you are still experiencing issues, our WordPress Troubleshooting guide can help you narrow down the cause further. Also, keep in mind that many commercial 3rd party plugins will provide support for their products. So, you may be able to contact them or submit a ticket to report issues.



Have you found one?
I ran the P3 scan and had the same issue with NextGen. It used 77% of my resourses. I’m going to start looking for a gallery plug-in that uses less.
-Jeff-