In This Tutorial:
The Google Chrome web browser includes a variety of Developer Tools that can help you while maintaining various components of your website. For instance, you can use the Chrome Dev Tools to edit CSS and preview live changes.
Because of the versatility of Google Chrome’s Developer Tools you can also pinpoint errors in your code and edit the script(s) live. In this guide, you can learn how to use Google Chrome Developer Tools to troubleshoot JavaScript live on your website, without affecting the experience for your users.
Access Dev Tools
There are multiple ways to access the Developer Tools in Google Chrome. You can follow any of the steps from the list below.
- With your web browser open, simultaneously press the Ctrl + Shift + i (for MacOS: command + option + i) keys on your keyboard.
- Click on the three (3) dot menu icon. Hover your mouse of More tools
Then, select Developer tools. - Right-click anywhere on a web page. Select Inspect from the menu list.
- Press the F12 key while on a web page–only on Windows/Linux.
NOTE: Any of the steps above will open the Developer Tools pane. To follow along with the example, it may be easier to open Dev Tools as a separate window. To do this simply click on the three (3) dot menu icon inside of the Dev Tools pane, then click to select the first icon in the Dock side setting to “Undock into separate window“. If you are using Windows/Linux, you can also press Ctrl + Shift + d to toggle between views.
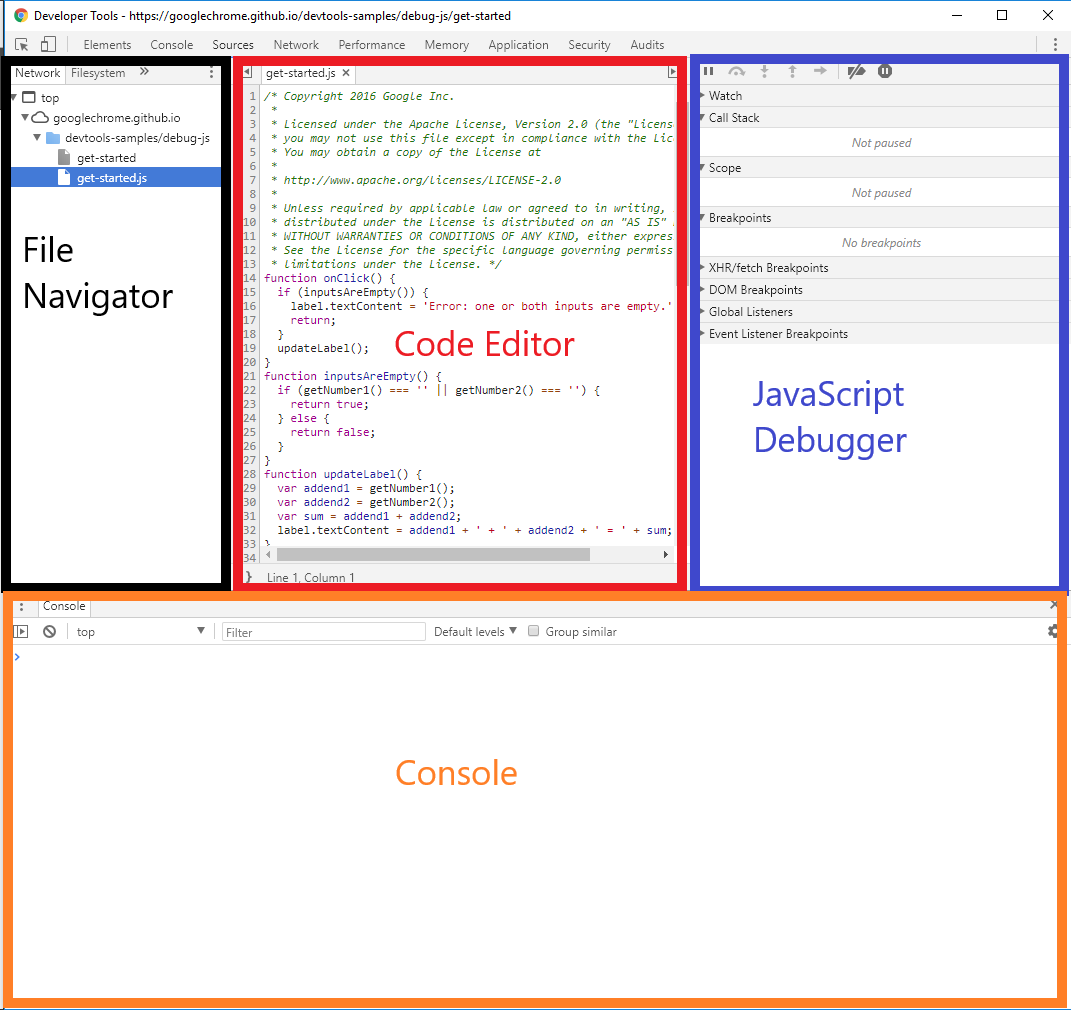
In a separate, maximized window the File Navigator pane appears in the first column (from the left), the Code Editor pane is displayed in the middle column, and the JavaScript pane appears in the third column (from the left). If the Dev Tools pane width does not allow for all three columns, then the JavaScript pane will be displayed below the File Navigator and Code Editor panes The Console pane appears below the other panes, regardless of the view choosen. If the Console pane is not displayed, simply press the Esc key and it should appear. See figure(s) below:
| Full Width | Partial Width |
|---|---|
 |  |
Troubleshoot JavaScript
After opening the Dev Tools pane, several tabs will be displayed for you to choose from. The instructions in this section will guide you through an example that you can learn how to troubleshoot JavaScript with the Developer Tools available in Chrome.
- Using Incognito Mode, navigate to https://googlechrome.github.io/devtools-samples/debug-js/get-started in your Google Chrome Browser.
- Open the Developer Tools pane.
- Click on the Sources tab.
NOTICE: The File Navigator pane opens. Here, the Network tab displays the files and scripts used to load the (currently displayed) website. The Code Editor pane will display the code for the script(s) and allow you to make modifications to preview live results (without affecting your user’s experience with your website). The JavaScript Debugging pane is where you will find more advanced tools to help you debug your website’s script(s).
- In the File Navigator pane, under the Network tab, click on the get-started.js file and its code will be displayed in the Code Editor pane.
- Insert a line-of-code breakpoint to tell Dev Tools to pause the script execution, to help you determine bugs/fixes for the code you are troubleshooting –at the particular line you choose. To do this, simply click on the number (to the left of the line of code) in the Code Editor pane.
NOTE: For the example, click on line 32 of the get-started.js file.
- Enter a value into the Number 1 and Number 2 fields on the actual page, then click on the Add Number 1 and Number 2 button.
NOTICE: For the example, enter the values 5 and 1. Also, the script pauses at the line of code selected (line 32) in the previous step.
- In the JavaScript Debugger pane, click on the arrow next to Scope to expand the view to display the Local and Global variable options. Then, click on the arrow next to Local to expand the view to include the current values of the variables.
NOTICE: The variables addend1 and addend2 are correct, however, the sum variable is appending addend2 to addend1 rather than adding the values together.
- Now, enter the following line of code into the Console:
parseInt(addend1) + parseInt(addend2)
Then, hit the Enter (for MacOS: return) key.
NOTICE: The value of the expression is the result of properly adding the integer values, rather than appending the string values.
- Replace the code at line 31 with the following code:
var sum = parseInt(addend1) + parseInt(addend2);
Then, press Ctrl + s (for MacOS: command + s) to save the script (locally in your browsing session).
- Click on the Deactivate breakpoints icon, from the JavaScript Debugger pane and then click on the Add Number 1 and Number 2 button to recalculate.
NOTICE: The values should be added accordingly and results should be correctly displayed.
IMPORTANT: The changes saved are NOT uploaded to the server. Therefore, you must make changes to the actual file(s) on your server to correct the JavaScript for your visitors.
Congratulations! You now know how to troubleshoot JavaScript using Google Chrome’s Developer Tools!