We have many guides on securing common web hosting solutions: cPanel servers, bare cloud servers, and even the popular WordPress content management system (CMS). Each includes great technical controls for a proactive approach to defense in depth. However, nothing can detect and prevent everything. The only way to address this is to apply administrative controls, primarily log auditing.
Audit log management, also known as security information management (SIM), is more than website analytics such as page visits, bounce rate, and referral URLs. It includes:
- Uptime
- Account-specific actions
- File change management
- Login attempts and failures
- Port and other reconnaissance scans
- Incoming and outgoing network traffic
The processes for auditing system-wide information and events are known respectively as security information management (SIM) and security event management (SEM). Combining the two types of information is known as security information and event management (SIEM).
Server logs are oftentimes neglected if not natively accessible from a graphical user interface (GUI). Proactively scanning these logs can help you understand your residual risk to cyber attacks not prevented by current technical controls and how to strengthen your security stance.
Below we’ll cover:
- What is Splunk?
- Installing Splunk
- Setting up Splunk
- Logging into Splunk
- Resetting Splunk admin credentials
- Monitoring data in Splunk
- Splunk apps and installation
What is Splunk?
Splunk Enterprise is a SIEM application that gathers, organizes, and visualizes machine-generated log data from local and remote machines, websites, and cloud services. Having Splunk setup with your physical and cloud systems can be valuable for staying ahead of cybersecurity, connectivity, and other big data initiatives.
How to Install Splunk Enterprise
Install Splunk Enterprise on CentOS
- Create an account on on Splunk.com.
- Select Free Splunk in the upper-right corner.
- Select Free Splunk.
- Select Linux, then Download Now beside
.rpm. - Upload the file to your server.
- SSH into your server as root.
- Install the Splunk Enterprise RPM file:
rpm -i path-to-file/splunk-versionnumber.rpm
- Continue to Splunk setup.
Install Splunk Enterprise on Debian/Ubuntu
- Create an account on on Splunk.com.
- Select Free Splunk in the upper-right corner.
- Select Free Splunk.
- Select Linux, then Download Now beside
.deb. - Upload the file to your server with SCP, replacing the filename, username, and server hostname as needed:
scp splunk-versionnumber.deb [email protected]:/root
- SSH into your server as root.
- Install the Splunk Enterprise DEB file:
dpkg -i splunk-file.deb
- Verify Splunk installation status:
dpkg --status splunk
- Continue to Splunk setup.
Change Your Default Shell
Splunk recommends using bash as your default shell as Debian’s default shell, dash, may cause zombie processes which cannot be killed. Below we’ll cover how to change your default Debian shell.
- Find your default shell:
which sh
- You should see
/bin/shor another symbolic link. Use ls to find the actual shell:ls -l /bin/sh
- If it doesn’t show
bashat the end, view installed shells to ensure it is installed:cat /etc/shells
- Delete the symbolic link:
rm /bin/sh
- Create a new symbolic link pointing /bin/sh to bash:
ln -s /bin/bash /bin/sh
Complete Splunk Setup
After you install Splunk, follow the steps below to complete your Splunk setup.
- Use Splunk to start the Splunk service:
/opt/splunk/bin/splunk start
- Read the license agreement. At the end, select y and Enter.
- Create an username.
- Create a password with at least eight characters.
- Once Splunk installation is complete, the last line will provide the URL to access the web interface:
http://serverhostname:8000. - Open port 8000 in your firewall: Firewalld, UFW, CSF, etc.
Keep in mind that if you get locked out of your server and restart it, you’ll need to start the Splunk service again before you can access the Splunk dashboard.
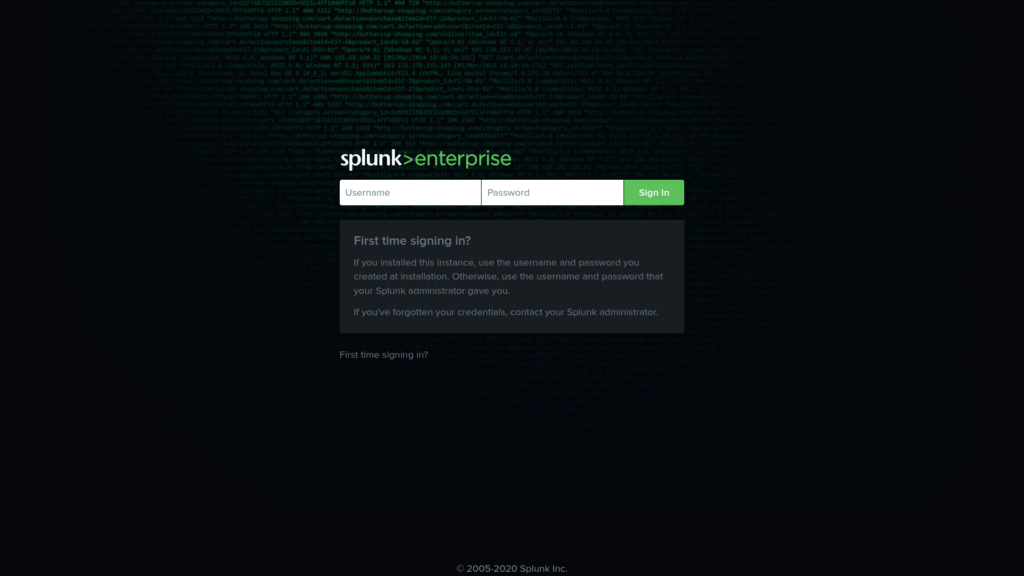
- Open your Splunk web interface in your browser.
How to Log into the Splunk Dashboard
There are multiple options for logging into your Splunk dashboard depending on your server configuration. What matters most is that you use :8000 at the end.
| Server hostname | http://vps#####.inmotionhosting.com:8000 |
| Server IP address | http://1.2.3.4:8000 |
| Primary domain | http://domain.com:8000 |

How to Reset Your Splunk Administrator Password
There’s no “Forgot password” link on the native Splunk login page. You’ll need to edit the Splunk passwd file.
- SSH into your server.
- Navigate to your Splunk /etc directory (e.g.
cd /opt/splunk/etc). You can use thefindcommand if needed.find / -iname splunk | grep etc
Don’t edit a file in the
/virtfsdirectory. - Rename the file
passwdto something else:mv passwd passwd.backup20201030
- Navigate to the Splunk
system/localdirectory:cd ../system/local
- Create and edit a new file:
nano user-seed.conf
- Inside the new file, add the following with a new username and password:
[user_info]USERNAME = adminPASSWORD = C0mp!c@T3Dp@s$w0RD - Save your file.
- Restart Splunk to create a new passwd file:
/opt/splunk/bin/splunk restart
- Log into your Splunk web interface with the new username and password.
Change Splunk Admin Username
If you want to change your admin username, possibly because you’ve noticed brute force login attacks for predictable usernames, follow the steps below to better secure your Splunk setup.
- Edit your Splunk passwd file:
nano /opt/splunk/etc/passwd
- Edit the username at the beginning of the file.
- Save your changes.
- Restart Splunk:
/opt/splunk/bin/splunk restart
- Log into Splunk.
Monitor Data in Splunk
Below we’ll cover how to add your first log source into your Splunk setup.
- Log into your Splunk web interface.
- Select Add Data.
- At the bottom, select Monitor.
- On the left of the Select Source page, select Files & Directories.
- Select Browse.
- Specify a file or directory to monitor and click Select. For example, you can monitor a cPanel log, Apache access log (similar to GoAccess Analytics), or a cPanel user directory. We’ll use the
/var/log/securelog file which tracks SSH logins, and authentication failures on CentOS. Debian/Ubuntu users will instead use/var/log/auth.log. - Select Continuously Monitor to show updates to the log file in real-time.
- At the top, select Next to access the Set Source Type page.
- Source type on the left should state “linux_secure” so Splunk knows it is Linux security information. Otherwise, select the button and select
linux_securefrom the drop-down menu. - Select Next at the top.
- (Optional) On the Input Settings page, you can change the App context, machine hostname, and Index.
- Select Review.
- Ensure everything is correct and select Submit.
- You’ll see “File input has been created successfully.” Start Searching.
- To modify the event results, select Settings and Data Inputs from the upper-right corner.
- Select the data input type on the left. For this example, we’ll select Files & Directories.
- Select Enable or Disable for the data path in the Status column.
Splunk Apps and Add-ons
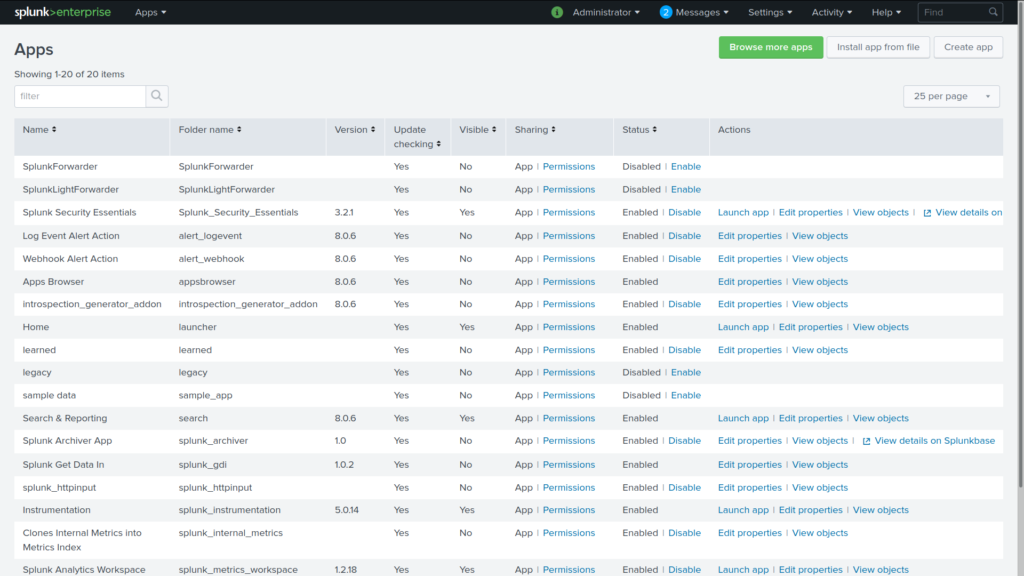
You can customize your Splunk setup with a massive database of apps and add-ons for better data analysis for your specific server environment. You can install Splunk apps from Splunkbase.Splunk.com/apps or directly within your Splunk dashboard.
From your Splunk dashboard, select the gear icon on the left beside Apps. On other pages, select Apps and Manage Apps from the top-left of the page. From here you can:
- Disable and enable installed apps
- Modify permissions
- Update settings
- Launch apps

At the top are links to browse installable Splunk apps, install apps manually, and create an app.
Install Apps in Splunk Dashboard

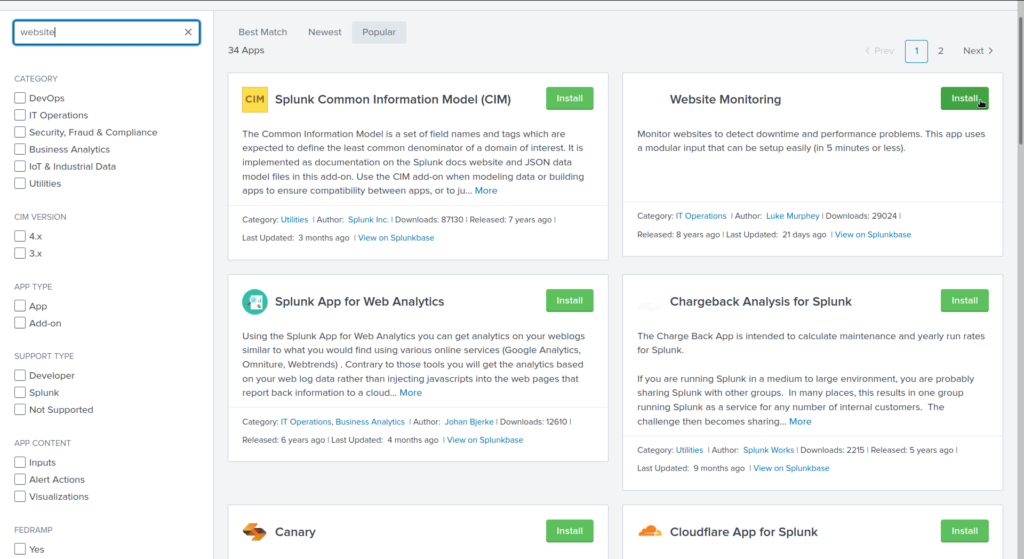
- From the Splunk homepage, select + Find More Apps on the left.
- On the left, search for an app.
- Select the Install button for the app you wish to install. We’ll use the Website Monitoring Splunk app for our example.
- Provide your Splunk.com user credentials, then accept the terms and conditions.
- Select Login and Install.
- If notified “Restart Required,” select Restart Now. Click OK once the restart is successful.
- Log back into your Splunk dashboard.
- Select Apps at the top or return to the homepage to see the new app available on the left.
Manually Install Splunk Apps
- Visit https://Splunkbase.Splunk.com.
- At the top, search for an app.
- Select an app. We’ll use the Splunk Add-on for Cisco ASA app as an example.
The Cisco ASA hardware firewall is available with our Dedicated Server Hosting plans.
- On the right, click Download, or Login to Download if applicable.
- Accept the license agreements and click Agree to Download.
- Save the file to your computer.
- Verify the checksum of your downloaded file against the provided message digest. For example:
Windows:certutil -hashfile SplunkFile.tgz sha256; echo ProvidedChecksum
Mac:shasum -a 256 SplunkFile.tgz && echo ProvidedChecksum
*nix:sha256sum SplunkFile.tgz && echo ProvidedChecksum
- Once you’ve verified the checksums match, press OK. If not, troubleshoot why the checksums differ before continuing to ensure you don’t upload a corrupted or malicious file.
- On the Splunkbase site, select the Details tab for additional installation information.
- In your Splunk web interface, go to your Apps page.
- Select Install app from file.
- Browse your local machine and select the compressed Splunk app file.
- Click Upload. If successful, you’ll see “[App] was installed successfully” and it’s already enabled.
Learn more about how to get the most out of your SIEM software with official Splunk documentation. Or learn more about free cybersecurity applications and how to stay updated on industry news.
Learn more from our Cloud Server Hosting Product Guide.
If you don’t need cPanel, don't pay for it. Only pay for what you need with our scalable Cloud VPS Hosting.
CentOS, Debian, or Ubuntu
No Bloatware
SSH and Root Access
