Table of Contents
A Resource Profile report can be very useful because it provides the statistics for your website’s resource consumption within the last twenty-four (24) hours. If you are experiencing excessive resource usage and it is not related to MySQL and/or IMAP activity, then generating and viewing a Resource profile report would help to diagnose if your website is consuming too many resources.
Each report contains data/stats in three tabs; Access Log Information, Check Software Versions, and Resource Information. In this guide, you can learn how to interpret the statistics in each of these tabs found in the Resource Profile report and how to resolve common causes for excessive resource usage identified by analyzing sample reports.
Access Log Information
The first tab displayed when viewing a Resource Profile report is the Access Log Information. Below is a descriptive list of the stats that are displayed on this tab:
| Access Log Information Details | |
|---|---|
| Hourly hits and response codes | How many requests for a page on your website and the code representing the response to the resquest(s). |
| Duplicate requests | How many requests made for the same file and the code for the response to the request(s). |
| Requests for non-static content | How many requests made for dynamic content and the code for the response to the request(s). |
| Top User Agents | The user agents (user agent is provided by the browser or machine) that are making the most request(s). |
| Top IPs | The IP addresses that are making the most request(s). |
From these statistics it is easier to visualize and diagnose excessive consumption of server resources than it is to dig through the DomLogs manually from the command line. Now, we can take a look at the various patterns in the Access log information tab details that we can use to identify website resource usage issues and how to mitigate excessive resource consumption.
Excessive Admin Ajax Requests
For this example, we installed WordPress, then logged into the Dashboard, minimized the window -leaving it in the background for about thirty (30) minutes, and then ran a new report.
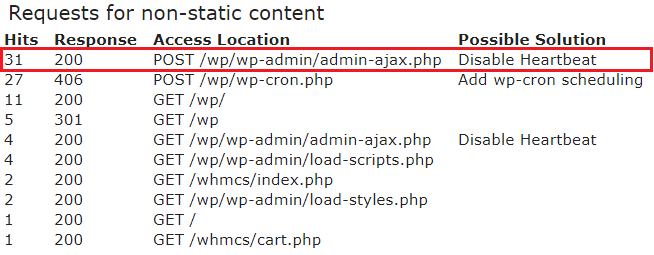
The following image is an excerpt from the Access log information tab from the Requests for non-static content section. These details show that admin-ajax.php has made thirty-one (31) requests.
NOTICE: The Response code for the admin-ajax.php requests is 200. 200 is the best response code you can receive because it means the response was successful!
This report indicates that during the thirty (30) minutes of “idling” in the Dashboard, there were thirty-one (31) requests made by admin-ajax.php. In this case, the Possible Solution column contains a link to a Support Center guide to help disable the WordPress Heartbeat because it could help reduce the amount of usage needed to run the WordPress Dashboard.
Cronjob Scheduling
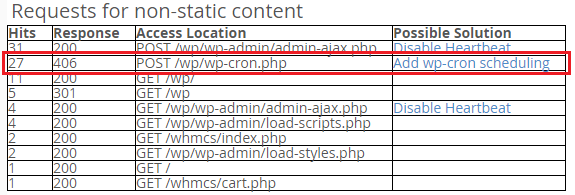
Using the same sample data from the Requests for non-static content the second top hit is wp-cron.php.
NOTICE: The Response column contains a value of 406 for the twenty-seven (27) requests for wp-cron.php. Addressing excessive errors can help to eliminate sporadic/unnecessary consumption of resources. For more information see our guide 406 Error – Not Acceptable.
The Possible Solution column suggests to Add wp-cron scheduling. Scheduling when cronjobs run is important to ensure that the server does not automatically run the cronjobs during times of increased traffic. Although the cronjob(s) may not use excessive resources, if they run during high level traffic times, it may cause your resource usage to spike over the limits available (even temporarily) which can reduce the quality of service.
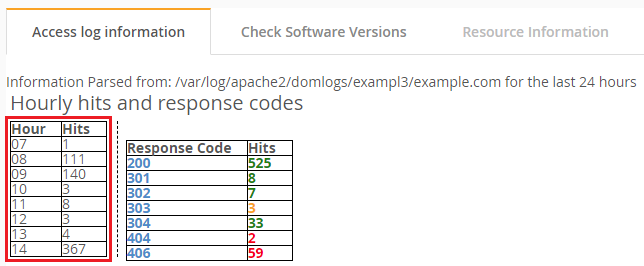
NOTE: Be sure to utilize the data from the Hourly hits and response codes section of the Access log information tab to determine the optimal scheduling for cronjobs. This way you can ensure that they do not run during heavy traffic times.
Excessive Bots Crawling Website

Search engines like Google, Bing, and Yahoo! will scan any data they can find online. Although they are designed to non-intrusively crawl your website at their leisure, this may generate a spike in server resource usage. To minimize the impact they have on your account’s resource usage, you can modify your robots.txt file to request to limit or deny search engines from crawling your website.
Malicious IPs

From this screen shot of the Top IPs on the Access log information tab, the example shows an IP address: 86.75.30.9 recorded with four hundred and forty-two (442) hits. Comparing that total to the total hits in this report (637-calculated from the hourly hits section), this IP accounts for almost seventy percent (70%) of the total requests.
If you notice an excessively large amount of requests coming from an IP address, you can evaluate blocking the IP address (like in the example above). Then, you can use the cPanel IP Deny Manager plugin to block IP addresses.
WARNING!: Use caution when blocking IP addresses that you are not familiar with. There may be resources that are not local to the server that are required for your website to communicate and run properly with remote servers. If you block an IP address and notice excessive amounts of errors as well as unexpected behavior with your website, consider unblocking that IP address.
Check Software Versions
The Check Software Versions tab contains details related to the software installed on your domain(s). Below is a descriptive list of the stats that are displayed on this tab:
| Check Software Versions | |
|---|---|
| Software | The name of the software that is installed. |
| Name | The name of the website (Site Title). |
| URL | The URL to access the website. |
| Path | The location to the installation directory of your website (aka: Document Root Directory) |
| Version | The version of the software that is installed. |
| Theme | The name of the currently active theme. |
| Cache | The availability of cache or name of plugin(s) used for caching. |
| Comments | The number of comments that exist. |
| Plugins | The number of plugins that exist. |
| List of Admin Users | A list of the admin users. |
| List of Active Plugins | A list of the active plugins. |
These details provide an easier alternative to checking the software manually. Now, we can take a look at the various details in the Check Software Versions tab information that we can use to diagnose and mitigate excessive resource consumption.
Out of Date Software
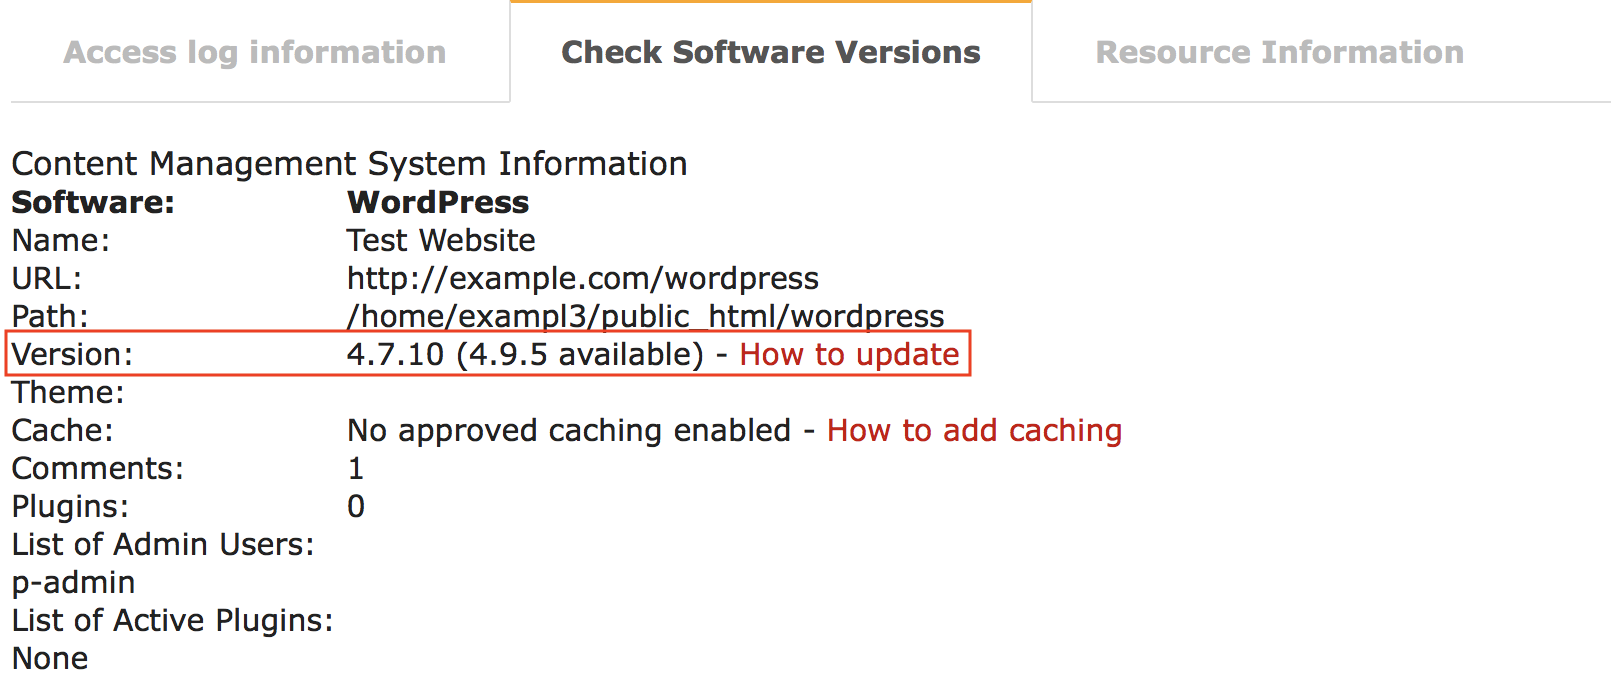
The Check Software Versions tab in the example report (displayed to the right) indicates that the version of WordPress is outdated. When analyzing your own report, compare the current version (4.7.10) to the available version (4.9.5). In this case, this line also contains a link to our Support Center guide on how to update WordPress.
Bugs and security vulnerability fixes are important not only to ensure your data remains private and secure, but also to ensure that your website is running optimally and your account is not targeted by hackers. Any outdated software displayed in the Check Software Versions should be backed up and then updated.
No Caching
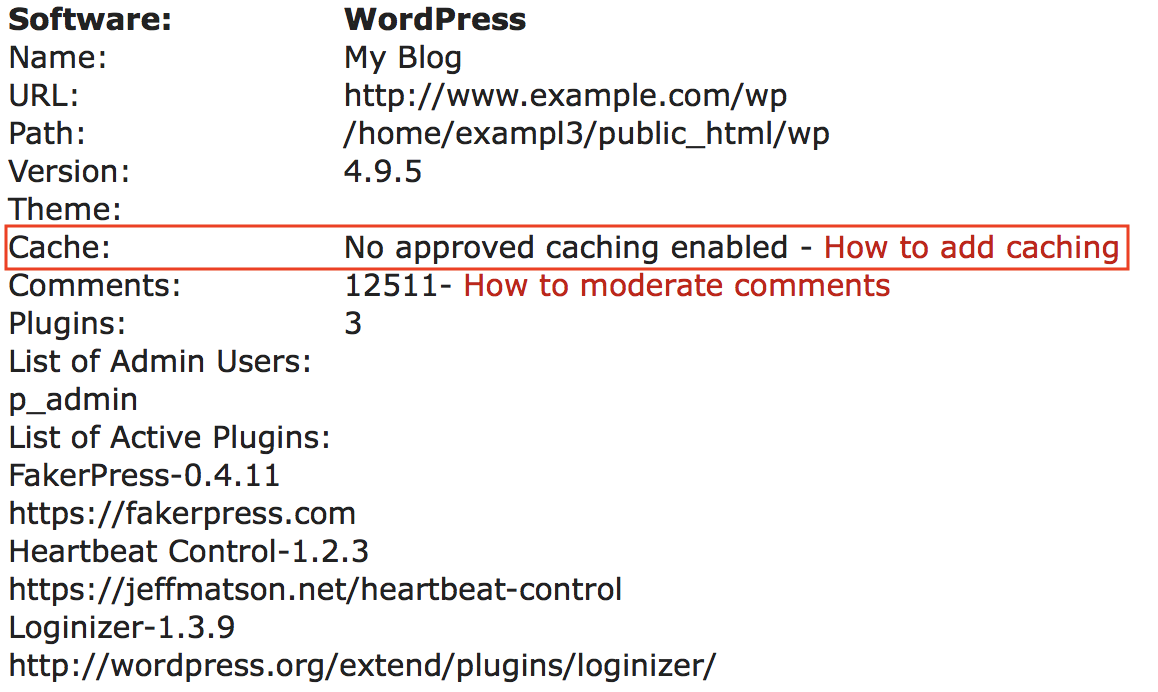
In analyzing the sample report, we can see that there is no caching implemented. The best analogy for explaining how cache works is like using a tool box. If you are working on fixing something in the bathroom upstairs, it is less work to bring the entire tool box (full of tools you use commonly for repairs), rather than go up and down the stairs for each tool that is needed to complete the job. Caching works the same way. If the script has already been run, the results are cached/saved for quick access to reuse the data, thus reducing the consumption of resources to process the script over and over again. For more information on how to implement caching, you can review our guide Use WordPress cache to speed up your site.
Excessive Amount of Comments
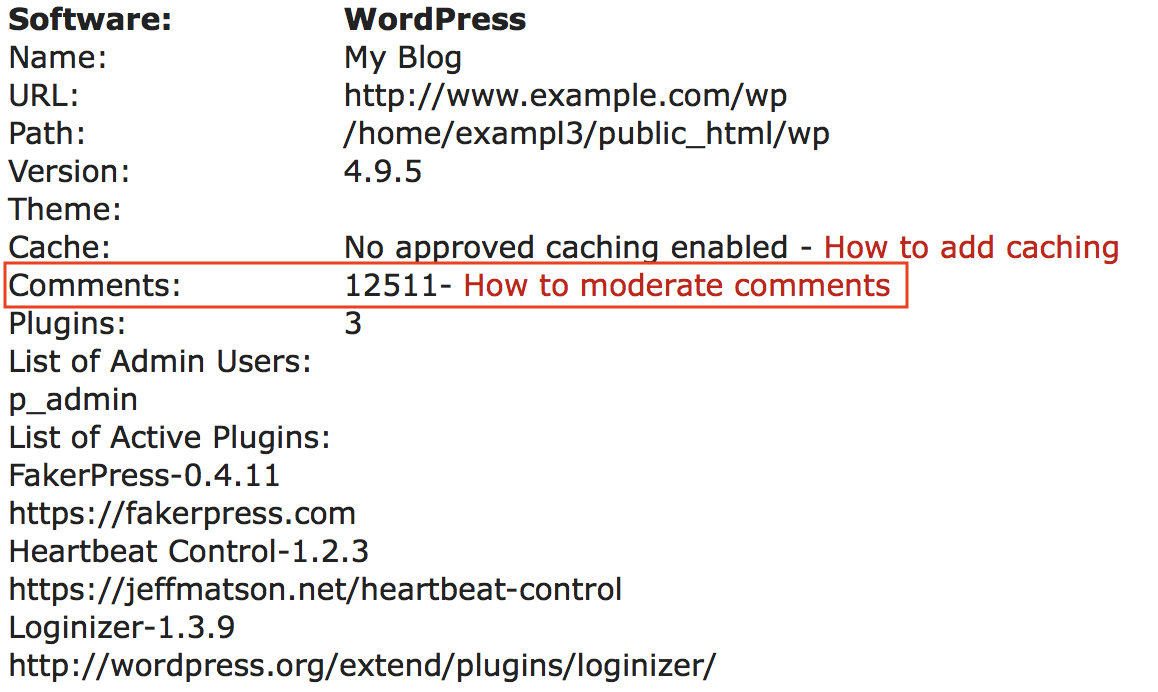
The sample data we are using indicates the amount of comments (12,511 total) on the website. Each time a page loads with comments, MySQL needs to parse through all twelve thousand comments to determine which ones load on the page. Consider moderating your comments and reduce the amount as much as possible. This will help to avoid excessive resource consumption.
Congratulations! Now you know how to analyze the Resource Profile to identify and resolve common issues involving excessive resource consumption. We also recommend our guide What is Excessive Server Resource Usage and How to Fix it.