In this article we’ll go over viewing your website’s statistical report available from Logaholic in cPanel. Logaholic can provide you with a quick general overview of the website traffic you’ve been receiving including the amount of visitors and their page views. It also has much more powerful reporting tools that lets you drill down and get a better understanding of your statistics.
- Login to your cPanel.
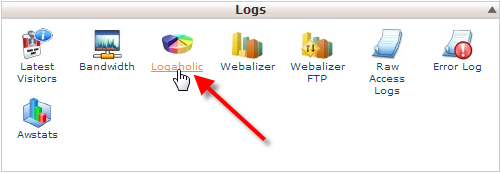
- Under the Logs section, click on Logaholic.
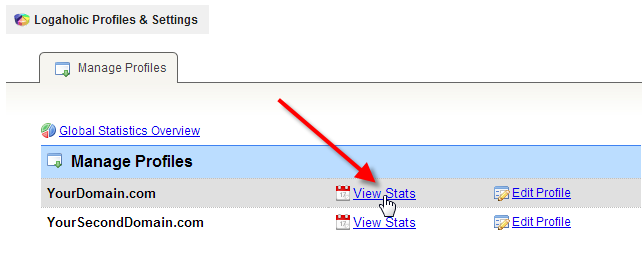
- Click on View Stats beside the domain you’d like to view the stats report for.
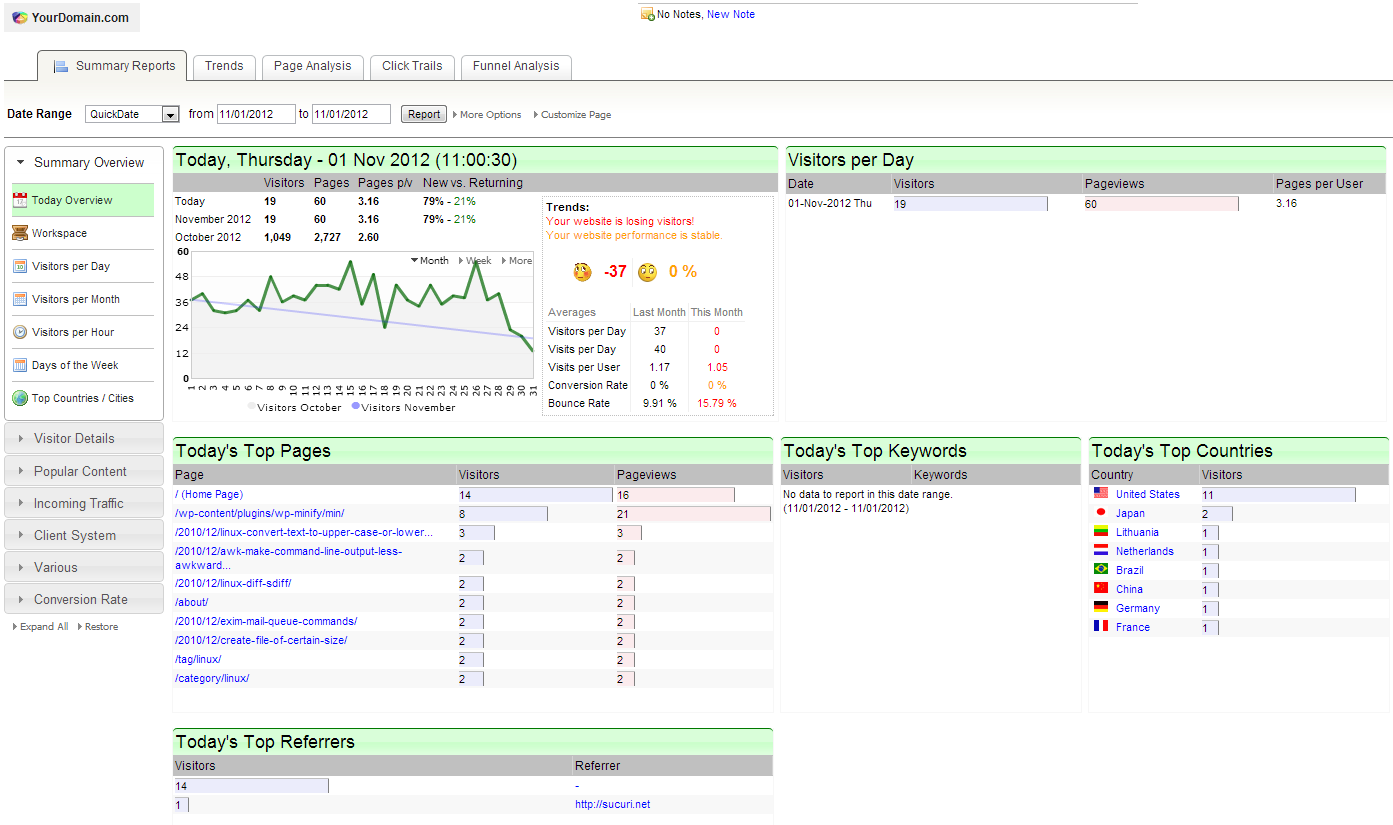
- You should now see the main Logaholic dashboard.

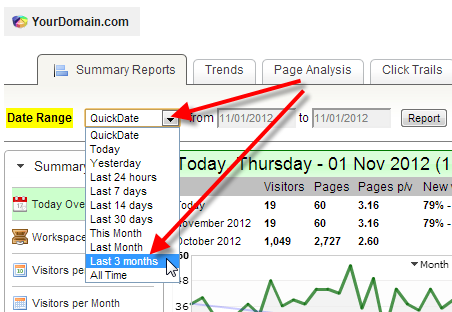
- A common task you might wish to do is seeing a larger date range than the default, you can click on the Date Range drop-down and select your desired range.

- With your Date Range selected, click on Report.

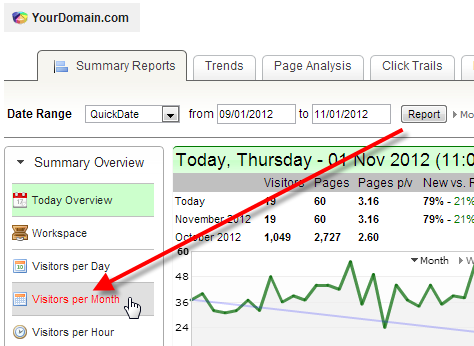
- Now you can click on a different type of summary, such as Visitors per Month to view that data for the selected date range.

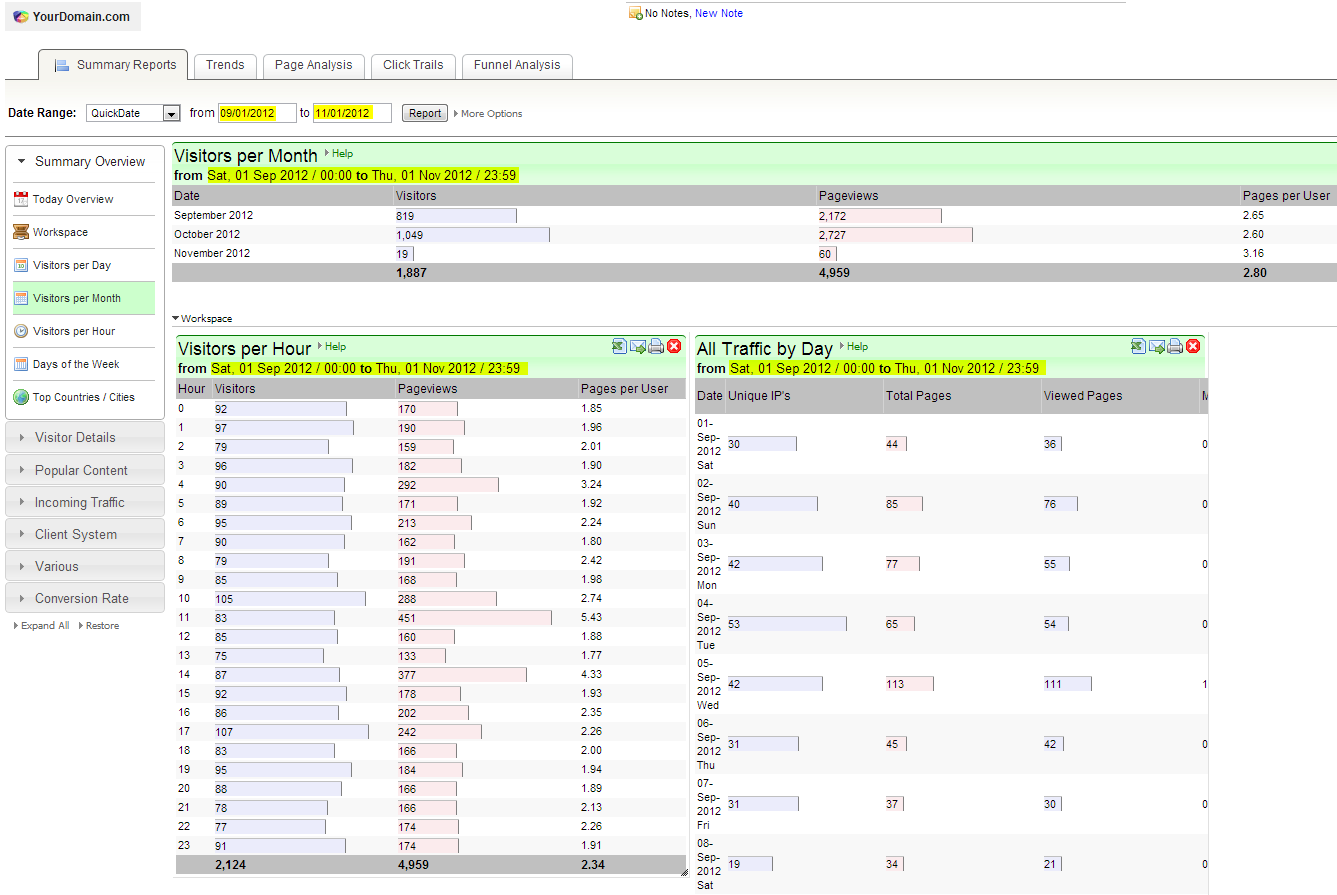
- You should now see your date range in use for the selected report.

You should now know how to view your stats reports using Logaholic, which should help you get a general idea of where your traffic is coming from. Logaholic has many advanced features that can help you get a really good understanding of your statistics and we would recommend reviewing the Logaholic manual for more in-depth explanations of all its feautres.
