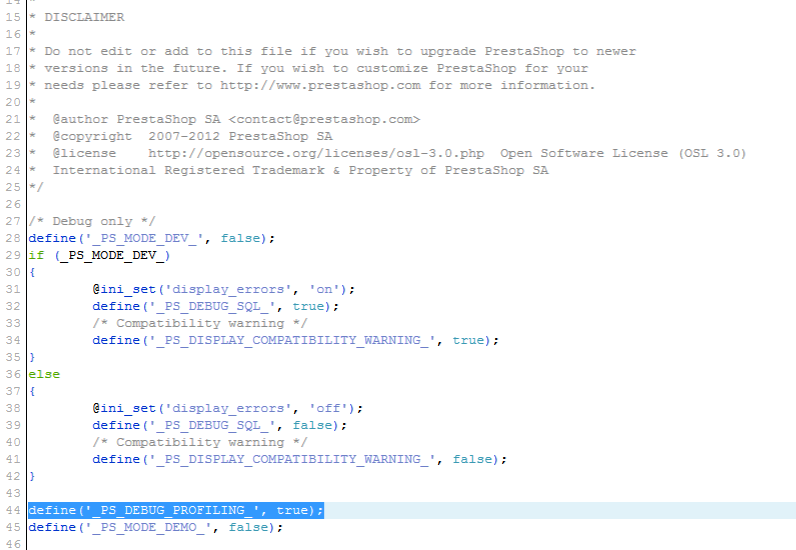
PrestaShop includes several debugging options including one called Debug Profiler. This allows you to see everything that is running on the page and will also give performance data such as the time it take for data to load. The following article shows you how to enable the Debug Profiler within PrestaShop 1.5.
Please make sure to create a backup before making the change to the Prestashop configuration file. This will allow you to return to a working point if needed.
How to Turn On the Debug Profiler in PrestaShop 1.5
- Login to the Cpanel
- Scroll down to the Files section and Click on Cpanel File Manager. Optionally, you can use FTP and edit the file with your favorite editor.
- In the File Manager (or FTP client), locate the files that make up your PrestaShop installation. Look in the folders of the installation for the CONFIG folder. Double-click on it to see its contents when you find it.

Find the DEFINES.INC.PHP file. Click on the file to highlight it, then click on the EDIT or CODE EDITOR icon at the top of the File Manager interface.
- Scroll through the code until you find “define(‘_PS_DEBUG_PROFILING_’, false);“. Change “false” to “true“.
- Click on SAVE CHANGES in the top right hand corner of the editor.
Login to the PrestaShop Administrator Dashboard or view the shop website (the front end) created by PrestaShop. When you scroll to the bottom of the screen you will see the data listed for all the code running on that page. You can see performance results as well as all the database queries. Here’s a screenshot showing an example of the output you may say (note that the sample is only a portion of the screenshot as it is a very LARGE list of data that is shown):

NOTE: Make sure that your store is not available to customers or only available for a minimum period when the debugging the data being show.


