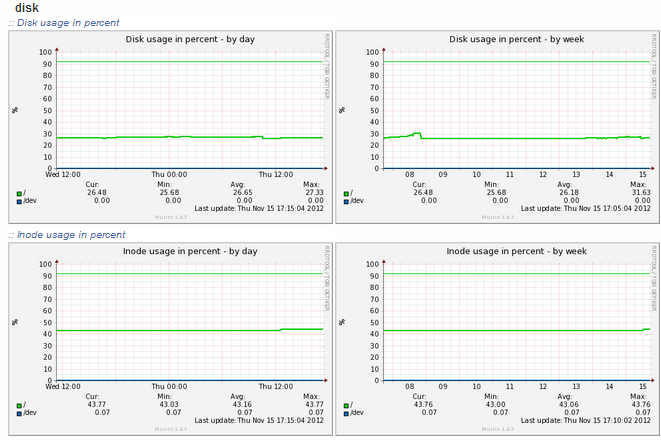
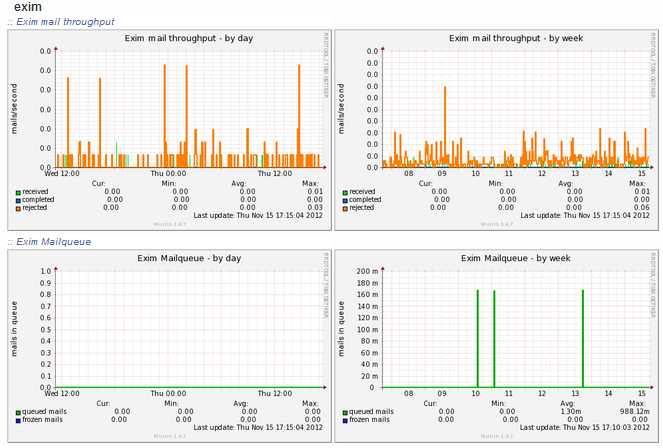
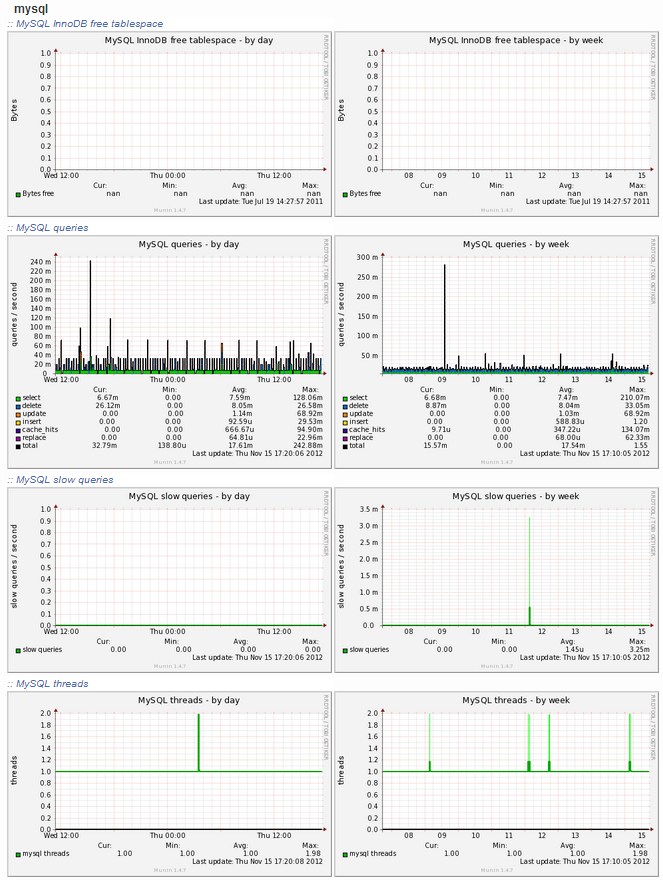
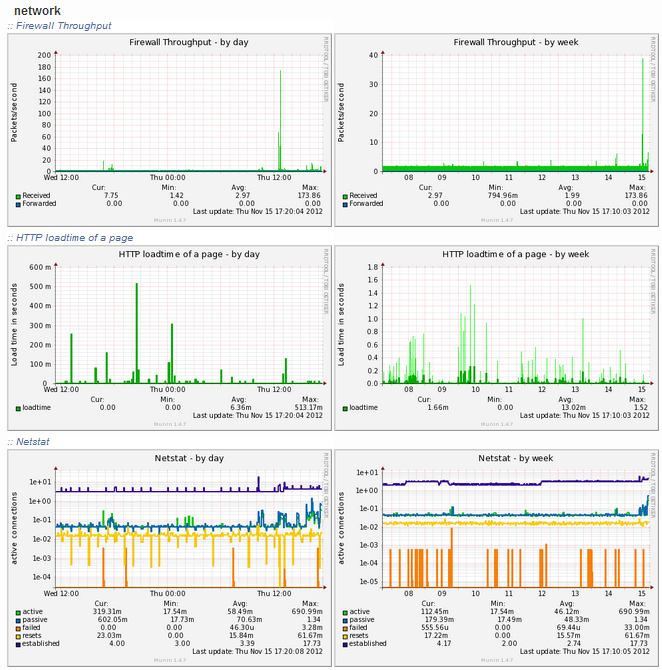
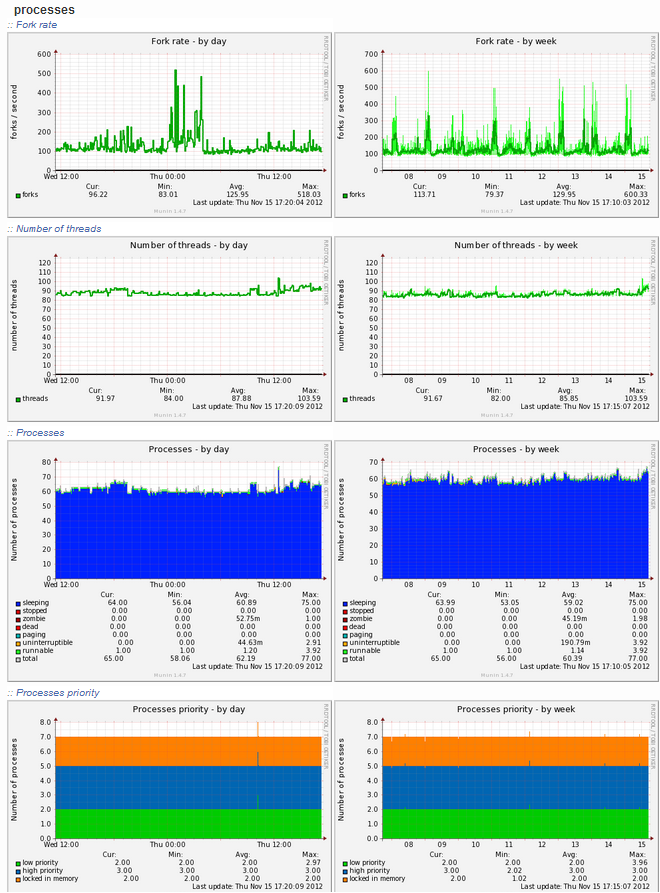
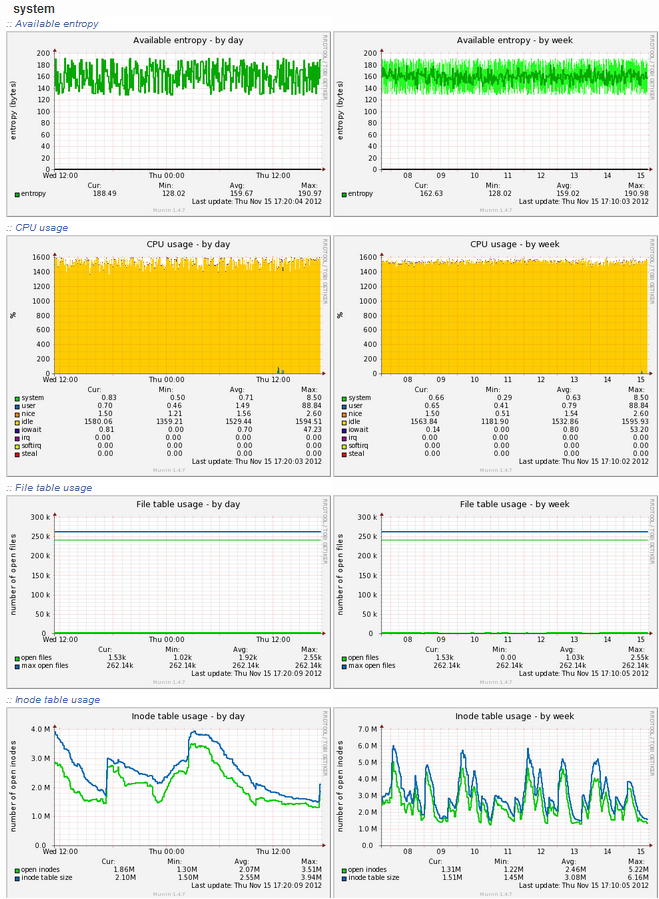
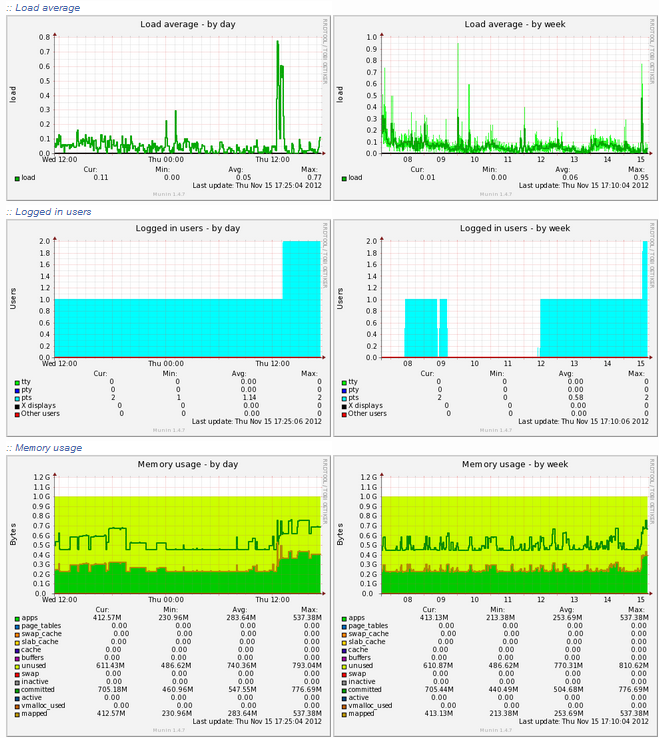
In this article we’ll discuss installing the Munin plugin for cPanel/WHM. With the Munin Server Monitor plugin you can get a quick overview of what your server has been up to with reports on Apache, Disk Usage, Exim, MySQL, Network, Processes, and other System activities.
To install the Munin plugin yourself this would require root access on either your VPS (Virtual Private Server) or dedicated server. Or if you would like for a $25 installation fee we can install the Munin plugin for you.
If you already have root access on your server, below are the steps needed in order to get Munin installed and to start collecting data.
Munin plugin error unregistered application
Please note in certain cases it’s been reported to us that people are getting the following error in WHM when attempting to install Munin:
HTTP error 401 cgi/addon_munin.cgi

WHM is configured to disallow execution of unregistered applications when logged in as root or a reseller with the "all" ACL.
If this is the case for you, you can folow these steps to still install the Munin plugin:
- Login to your server with SSH as the root user.
- Create the following folder if it doesn’t exist already with:
mkdir /var/cpanel/apps

chmod 755 /var/cpanel/apps - Next create a configuration file with the (.conf) extension for the Munin plugin.
vi /var/cpanel/apps/addon_munin.conf
Populate it with this data:# name name=addon_munun
# Service that will serve this app service=whostmgr
# Physical path: /usr/local/cpanel/3rdparty/Foo.php
# Literal URL path: $server:$port/$cpsession/3rdparty/Foo.php url=/cgi/addon_munin.cgi
# System user to run process as user=root
# Required acls acls=any
# Display name as show in the service ui displayname=addon_munin - Finally register the plugin with WHM by running the following command:
/usr/local/cpanel/bin/register_appconfig addon_munin.conf
If you wanted to un-register the plugin you could run:/usr/local/cpanel/bin/unregister_appconfig addon_munin.conf
If you’d like to display all the currently registered plugins you can run:/usr/local/cpanel/bin/show_appconfig
You should now be able to follow the steps below like normal to install the Munin plugin for WHM.
Install the Munin plugin in WHM
- Log into WHM.
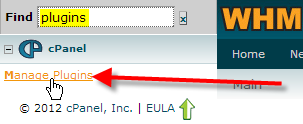
- In the top-left Find box, type in plugins, then click on Manage Plugins.

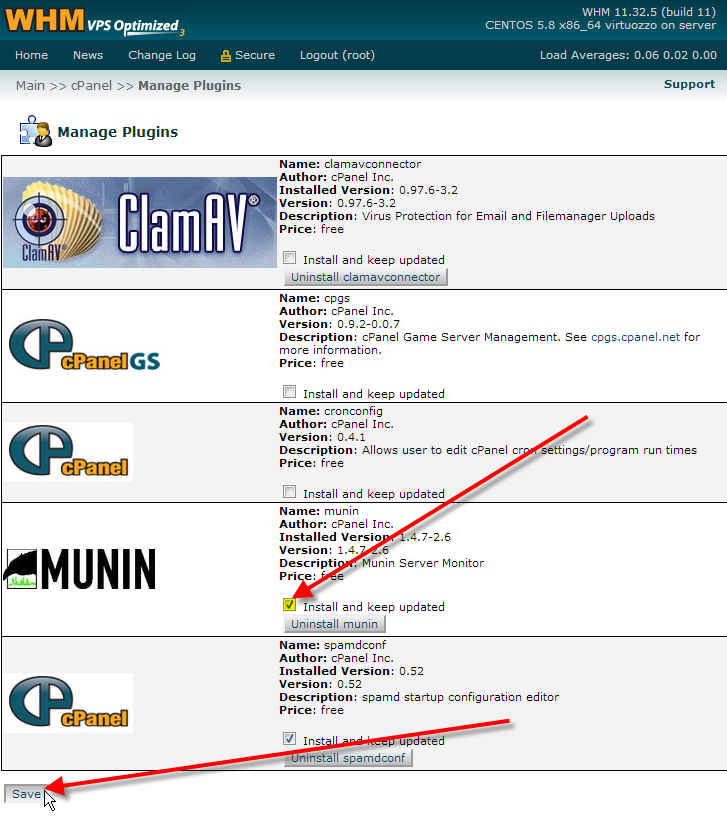
- Place a check beside Munin in the Install and keep updated selection box, then click Save at the bottom.

- The install process should take about 3-5 minutes, and during that time you don’t want to close your web-browser. When it finishes you’ll see a Process Complete message at the bottom of the screen.

- Log out, and then back into WHM again.
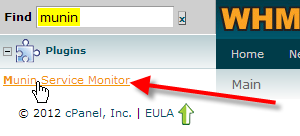
- In the top-left Find box, type in munin, then click on Munin Service Monitor.

- Now Munin sets up a cronjob to gather statistics every 5 minutes, so when you first look through your reports there won’t be any data populated into them yet. So typically you’ll want to wait at least 24 hours before you start reviewing the reports.
- You can click on your server’s hostname, in this case server.inmotionhosting.com in order to get to a full summary of all the available reports.

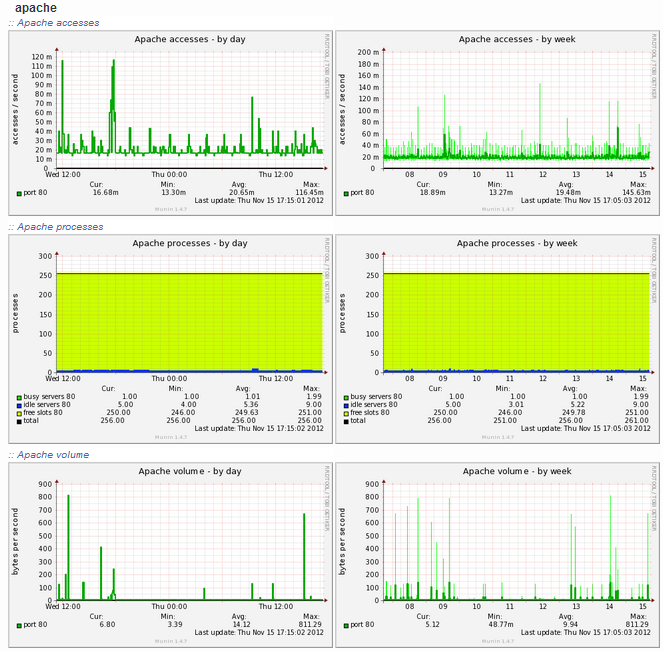
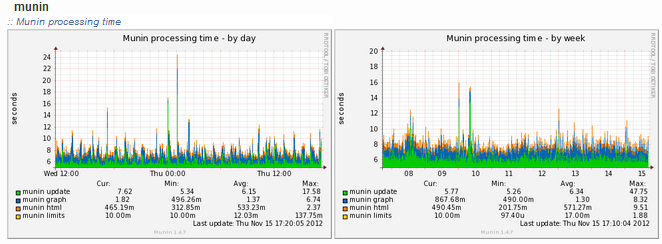
- Below are some screen shots of the various reports available that you can get to by either scrolling down your main report page, or by clicking on one of the header links such as Apache at the top. You can also click on any of the individual report graphs to be taken to the monthly and yearly reports for that category as well:
You should now know how to get the Munin plugin installed in WHM which should help your keep tabs on the activity that happens on your server.


Thanks for the response. However, you still didn’t quite explain Munin graphs. Where can I find that “Load Average” on munin so I can see the historical load trend so I know the impact of the changes im making on my sites.
As much as I apprciate the references you provide but this quide is about Munin so I’m hoping to understand how to use it in response to inmotion’s boundaries once it’s installed.
Thanks
Hello Ash,
The Munin graph was not meant to show you the Load Average. You’ll find that number only in the WHM interface. The Munin graph was provided as a tool to help you gather information on your server resource usage (as per the Server Usage article). It provides more detail to help understand what is actually consuming your resource usage. This information helps you then plan your plan of action to help reduce this number to help keep your server usage optimal.
Regards,
Arnel C.
Thanks, useful article.
Maybe consider not recommending vi for creating the config file, or specifying the keys needed to exit and save. Nano is easier.
Step 6 has a typo. Should by “type munin”, not “type plugin”.
Hello Kieran,
Thanks so much for you comments! I can understand about vi – it’s just a matter of preference – but I prefer nano also. Step 6 will be corrected in just a minute. Thanks for catching the typo and letting us know!
If you have any further questions or comments, please let us know.
Regards,
Arnel C.
Can you share some information on which graphs to keep an eye on what is the tolerance level set by inmotion for VPS servers? I understand CPU is a big one, but which one exactly is that and what’s the number I should strive to stay under?
Hello Ash,
The general number you should be looking to stay under is a Load Average of 1 – this number can be found in WHM in the top right hand corner when you login. You can find many Advanced Server Load monitoring options here and if you find yourself consistently having issues with the load average, then you can use the articles in the Server Usage section to help determine where the problem is occurring.
I hope this helps to answer your question, please let us know if you require any further assistance.
Regards,
Arnel C.
Thanks for posting these codes on this blog. I am using a dedicated server and searching for it.
I have acquired the root access password at AMP and used that to log into WHM. However, in step 1 above, after typing in ‘plugins’ in the search field, I am not presented with any option to ‘manage plugins’. Here is the version info from the header bar:
CENTOS 6.6 x86_64 virtuozzo – vps9908 WHM 11.34.2 (build 8)
What am I doing wrong?
Hello Carl,
Sorry for the problems with the login. However, I am unable to duplicate the issue here. I was able to take your root login and see the plugin manager with no problems. I used vps9908.inmotionhosting.com/whm as the URL to get to your login screen. Try that, and make sure you’re using “ROOT” as the user name when you’re logging as the root.
Hopefully, that will clear up the issue. If you continue to have any problem, please contact us by providing a reply with more information detailing the problem, or call in to our live technical support team.
Regards,
Arnel C.
Sorry it looks like we missed your comment. I just updated the article today 12/4/2013 with more information on how you should be able to get this to work with the latest versions of WHM.
Please let us know if you’re still having any issues at all.
– Jacob
This is out of date and cannot be accomplished on your current version of WHM
Thanks, got that up. But now how do I see my site-under-construction? When I change colors, etc., and click on See your Site, I get sent to my “under construction” image of my site.