In this article, we’ll discuss more advanced methods for checking on your server’s load averages to help determine at what times your server’s usage might be spiking.
If you’ve read our previous article on server load monitoring, you should have a good understanding of what a load average represents and how you can see the live load average of your fully Managed VPS server or Dedicated server using WHM (Web Host Manager).
For the examples below you’ll need to login to your VPS or dedicated server via SSH (Secure Shell). You can read our guide on how to login to your server via SSH in order to figure out how to get logged in this way so that you can follow along.
At this prompt you should be able to type in simple commands to get back specific information from the server. Here are a few commands you might use when looking at your server’s usage:
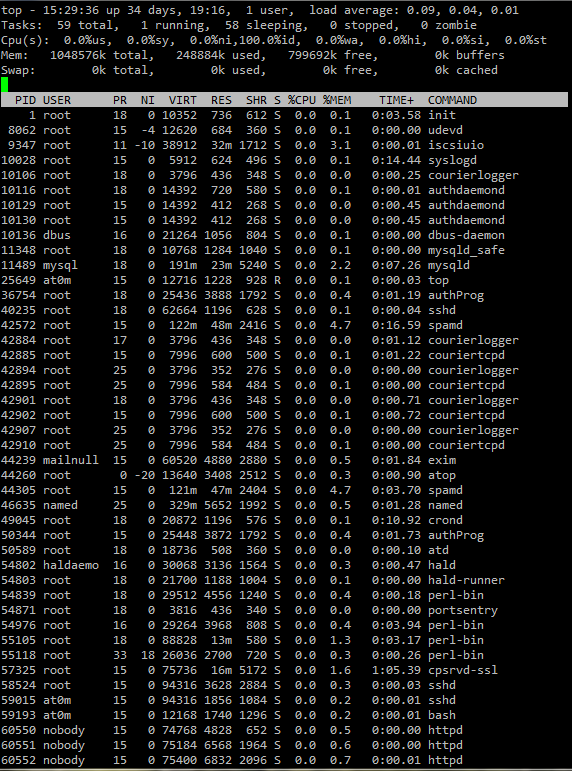
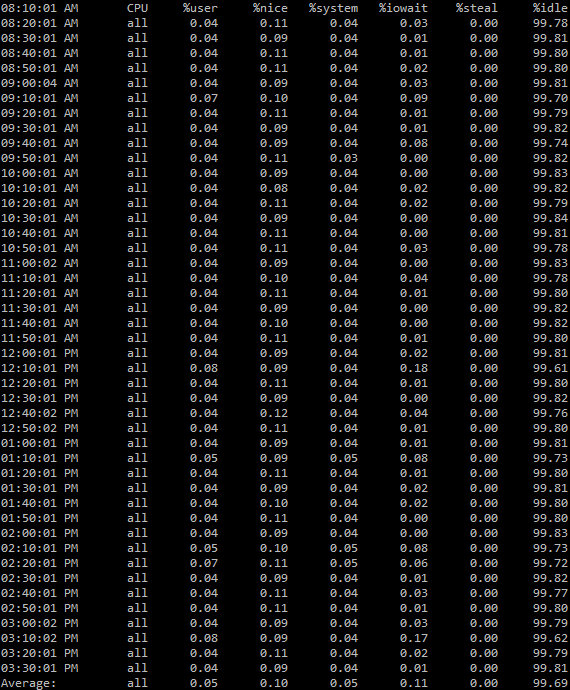
uptime – Provides simple output showing how long the server has been up for, how many users are logged in, and the current load average. top – Provides up to the minute information on currently running processes, also shows task states such as (running, sleeping, stopped, and zombie), shows memory usage as well as load averages. sar – Provides information from the System Activity Reporting logs, such as historical load averages or disk I/O wait over a 30 day period.If you’d like to see the historic load average on your server, you can utilize sar -q. The -q flag is used to pull the load averages from your sar logs.
These more advanced commands can be used programmatically to build up more robust tools for you.
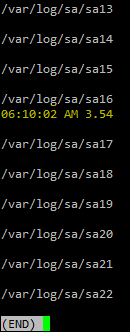
Below is an example that will go through all available load average reports and display anytime your load average would have been over a 1.00:
Code breakdown:
| for log in `ls -1 /var/log/sa/sa[0-9]*’; | This sets up a for loop with a variable called log, the value stored in this variable is going to be the current sar log that we’re looping through. |
|---|---|
| do echo $log; | This prints out the current sar log in our loop so we know any load averages that display under it will belong to that particular day. |
| sar -q -f $log | egrep -v “Average|ldavg|Linux” | This will run the sar command with the -q flag to show load averages, and the -f flag to load activity from a file. Then our $log variable is put in place so that it loads up the current date in our loop. Finally the egrep -v “Average|ldavg|Linux” commands strips aways any lines that contain those words, so all we’re getting back are actual numerical load averages. |
| awk ‘{if ($5>=1) print $1,$2,$5}’; | This uses the awk command which is used for controlling columnated data, we tell the server that we only want to print out columns $1,$2, and $5 but only when column $5 is greater than 1. |
| echo “”; done | less | This last part will simply print out a blank line after each loop to make it easier to read, and then issues our done command letting the server know we are done with the for loop that we started. Finally we “pipe” all of that information with the | character to the less command. This lets us easily page up and down through our results in the event that they took up more than one screen, and then you can just hit q to quit out of the date review mode once you’re done looking at it all. |
We recommend bookmarking our full guide on How to Stress Test Your Website / Top 3 Load Testing Tools for more information.


What should I expect my shared server load to be at? Is the load only for my account or the entire shared server?
Hello Jaden,
Server load is only seen by the System admins on shared servers. VPS server load should be below 1.0
Kindest Regards,
Scott M