When managing your server with InMotion Hosting, you can utilize the WebHost Manager (WHM) of your VPS or Dedicated hosting server to find what type of server you have. The below steps will explain how to view your server processor information, system information, current memory usage, and current disk usage.
Important! You can only view this information on VPS or Dedicated servers. Shared servers have no WHM access.
Finding Your Server Information in WHM
- Log into WHM as root.
- Navigate to Home > Server Status > Server Information.
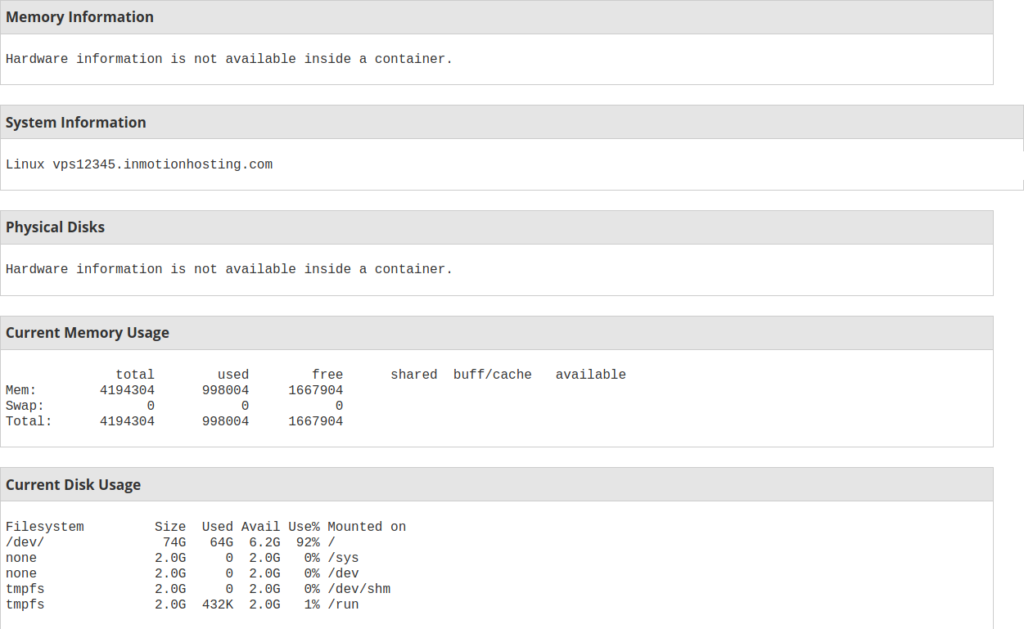
- Scroll to the bottom to see the memory and disk space. The image below shows what the section looks like.
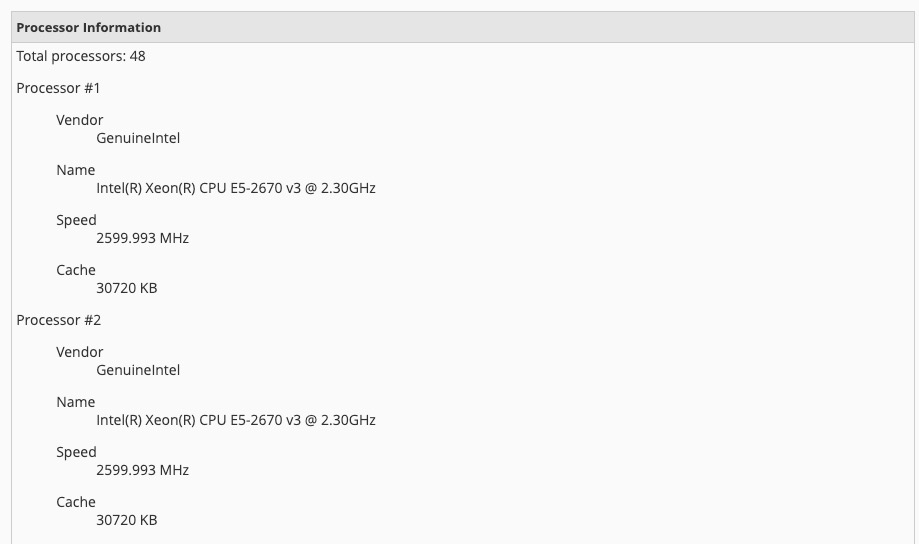
The list starts with the Processor information – notice that this screenshot is an abbreviated view. The total processors are 48, but only 2 are shown in the screenshot.


Current Memory Usage
Memory usage can be viewed in the server information stats. Below is an excerpt of the current memory usage on a VPS 4GB RAM with the free Linux terminal command. The total memory is 4GB for the VPS 4GB RAM plan and so on for the other plans. The used is the total memory currently used by the server. The free memory is what the server has left to use.
             total       used       free
Mem:       4194304     977768     1501352
Swap:            0          0          0
Current Disk Usage
Below is an excerpt of a VPS 4GB RAM plan with the df -h Linux terminal command. The Size is the total disk space on the server. In this example, this is a VPS 4GB RAM plan because it has 75 gigs of space. If you upgraded to a VPS 6GB RAM, you should see ~105gigs (the actual size will be a few gigs smaller in order to store server required information). The Used is the total space used including all cPanel accounts, the server operating system (OS), and systems files. The Avail is what’s available on the disk and the Use% is the total used in percent.
Filesystem            Size  Used Avail Use% Mounted on
/dev/vzfs              74G   64G   6.2G  92% /
none                  512M  4.0K  512M   1% /dev
Service Status
The other important information that you may find useful is the status of services on the server. This page also includes the System and Disk information. To open the Service Status page, please follow the steps below:
- Log into WHM as root.
- Navigate to Home > Server Status > Service Status.
- Scroll to the bottom to see the System Information and Disk Information. System Information will show you the details of the server load, memory used, and swap used. Disk information devices, mount points, and disk usage.
Note that the Service Status table will show only monitored services. You may need to use the Service Manager to enable monitoring of certain services.

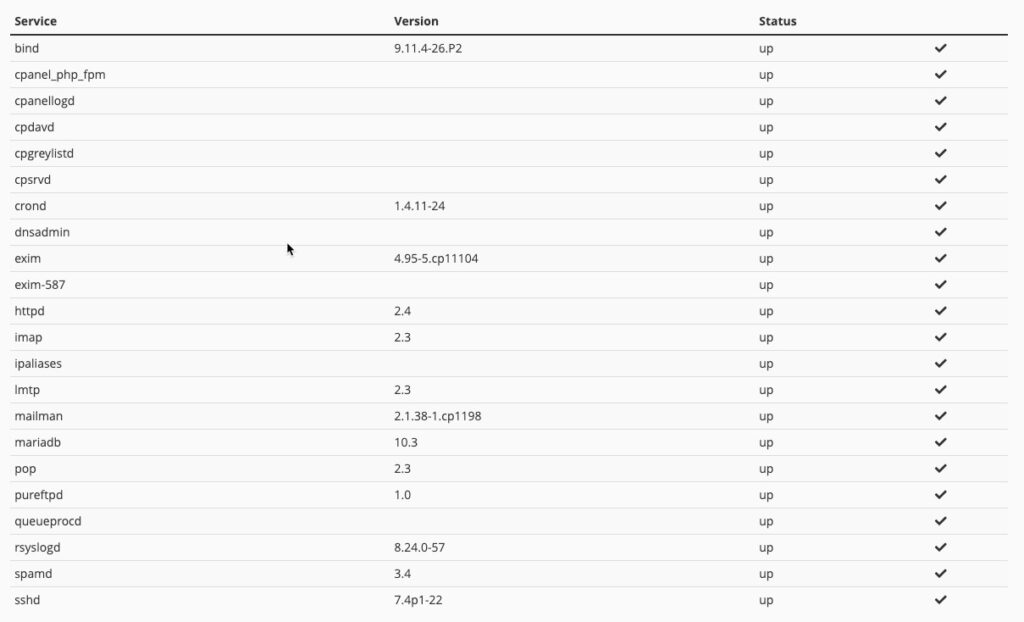
The services status section is important for troubleshooting your server because you can see a lot of key services that are running, their version, and their status. For example, in the table above you can see the mail server, cron, database, FTP, IMAP, and POP versions being run on the server.
Upgrade to VPS Hosting for Peak Performance
Upgrade to InMotion VPS Hosting today for top-notch performance, security, and flexibility, and save up to $2,412 – a faster, stronger hosting solution is just a click away!
SSD Storage
High-Availability
Ironclad Security
Premium Support
Please info on how to check what software i am running on my server .. From whm thank you
Hello Jaime,
Sorry, but I’m not sure what you’re referring to. By default, cPanel is running as the interface. Beyond that, nothing is loaded on the server. You have to load it or make a request to load it yourself. You can also use phpinfo.php to see the support applications that are running in the background (.e.g php, mysql, etc).
If you have any further questions, please let us know.
Kindest regards,
Arnel C.
Is there a way to see some sort of graph that shows how and when the memory is being used over the month? For example let’s say I want to know if there is a moment of the day where I almost run out of memory, where can I check that?
Thanks
You can check the “Daily Process Log” under Server Status in WHM.
Thanks. this post helpfull